Airborne ISR Market Analysis, Size, and Forecast 2025-2029: North America (US), Europe (France, Germany, Russia, UK, and Ukraine), APAC (China, India, and Japan), and Rest of World (ROW)

Airborne ISR Market Analysis, Size, and Forecast 2025-2029:
North America (US), Europe (France, Germany, Russia, UK, and Ukraine), APAC (China, India, and Japan), and Rest of World (ROW)

Published: Jun 2025 238 Pages SKU: IRTNTR45271

Market Overview at a Glance

$5.40 B
Market Opportunity
3.7%
CAGR
3.6
YoY growth 2024-2025(%)

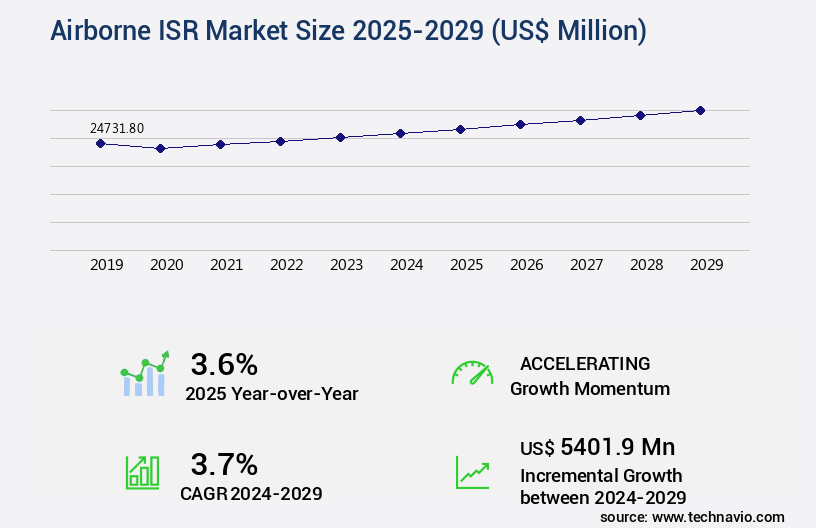
Airborne ISR Market Size 2025-2029

The airborne isr market size is valued to increase by USD 5.4 billion, at a CAGR of 3.7% from 2024 to 2029. Rising geopolitical tensions and security threats will drive the airborne isr market.

Major Market Trends & Insights

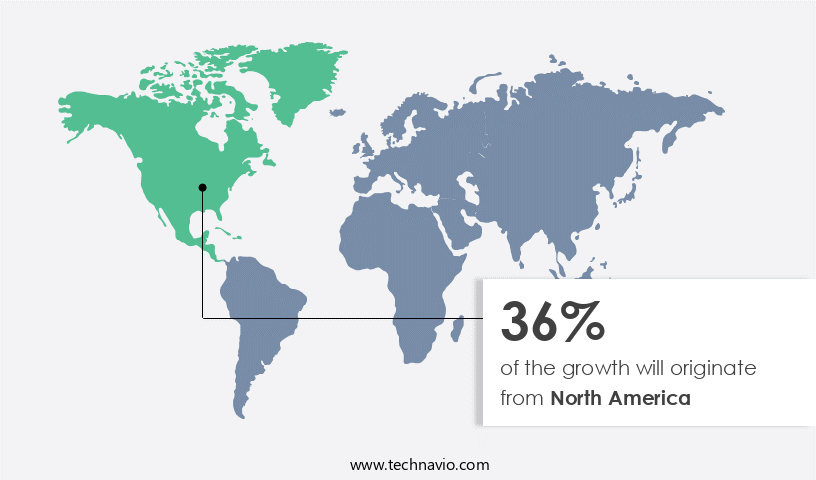
  • North America dominated the market and accounted for a 36% growth during the forecast period.
  • By Technology - EO and IR segment was valued at USD 7.36 billion in 2023
  • By Vehicle Type - Unmanned airborne ISR segment accounted for the largest market revenue share in 2023

Market Size & Forecast

  • Market Opportunities: USD 31.26 million
  • Market Future Opportunities: USD 5401.90 million
  • CAGR from 2024 to 2029 : 3.7%

Market Summary

  • The Airborne Intelligence, Surveillance, and Reconnaissance (ISR) market is experiencing significant growth due to escalating geopolitical tensions and increasing security threats worldwide. Airborne ISR systems enable real-time monitoring and analysis of large areas, providing valuable intelligence for defense and civilian applications. The integration of artificial intelligence (AI) and machine learning (ML) technologies is revolutionizing the market, enabling advanced data processing and analysis, leading to improved situational awareness and operational efficiency. However, regulatory and airspace restrictions pose challenges to market growth. For instance, in a logistics company, airborne ISR systems are utilized to optimize supply chain operations by monitoring transportation routes and identifying potential disruptions.
  • A notable example of efficiency gains comes from a leading logistics firm that implemented an airborne ISR system, resulting in a 15% reduction in delivery delays and a 10% decrease in operational costs. This success story underscores the potential of airborne ISR systems in driving business growth and enhancing operational effectiveness.

What will be the Size of the Airborne ISR Market during the forecast period?

Airborne ISR Market Size

Get Key Insights on Market Forecast (PDF) Request Free Sample

How is the Airborne ISR Market Segmented ?

The airborne isr industry research report provides comprehensive data (region-wise segment analysis), with forecasts and estimates in "USD million" for the period 2025-2029, as well as historical data from 2019-2023 for the following segments.

  • Technology
    • EO and IR
    • SAR
    • SIGINT
    • MASINT
    • Others
  • Vehicle Type
    • Unmanned airborne ISR
    • Manned airborne ISR
  • Application
    • Defense and military
    • Homeland security
    • Civil and commercial
  • Geography
    • North America
      • US
    • Europe
      • France
      • Germany
      • Russia
      • UK
      • Ukraine
    • APAC
      • China
      • India
      • Japan
    • Rest of World (ROW)

By Technology Insights

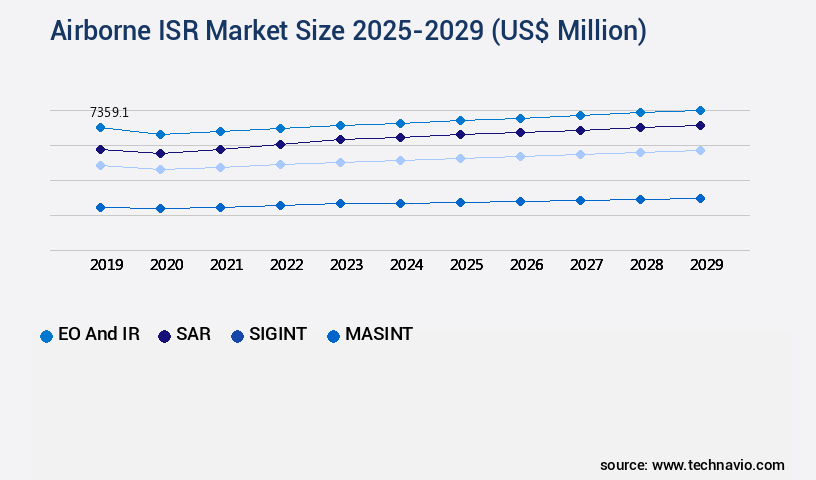
The eo and ir segment is estimated to witness significant growth during the forecast period.

Airborne Intelligence, Surveillance, and Reconnaissance (ISR) markets witness continuous evolution, with electro-optical and infrared (EO/IR) technologies playing a pivotal role. EO systems, utilizing high-resolution cameras, capture detailed aerial imagery during daylight hours. Essential for visual identification, terrain mapping, and real-time surveillance, these technologies are integrated into various platforms, including unmanned aerial vehicles (UAVs), helicopters, and fixed-wing aircraft. Infrared technology, meanwhile, detects thermal signatures, enhancing monitoring capabilities in low-visibility conditions. Combined, these capabilities ensure uninterrupted situational awareness, enabling missions in various sectors such as public safety, environmental monitoring, precision agriculture, border security, and infrastructure inspection. For instance, UAVs equipped with EO/IR sensors and data analytics software have revolutionized disaster monitoring and reconnaissance missions.

The integration of advanced technologies like lidar, synthetic aperture radar, hyperspectral imaging, and data fusion algorithms further enhances the capabilities of these systems. With the global market for airborne ISR projected to reach USD133.5 billion by 2027, representing a 6.3% compound annual growth rate, the demand for advanced EO/IR technologies continues to surge.

Airborne ISR Market Size

Request Free Sample

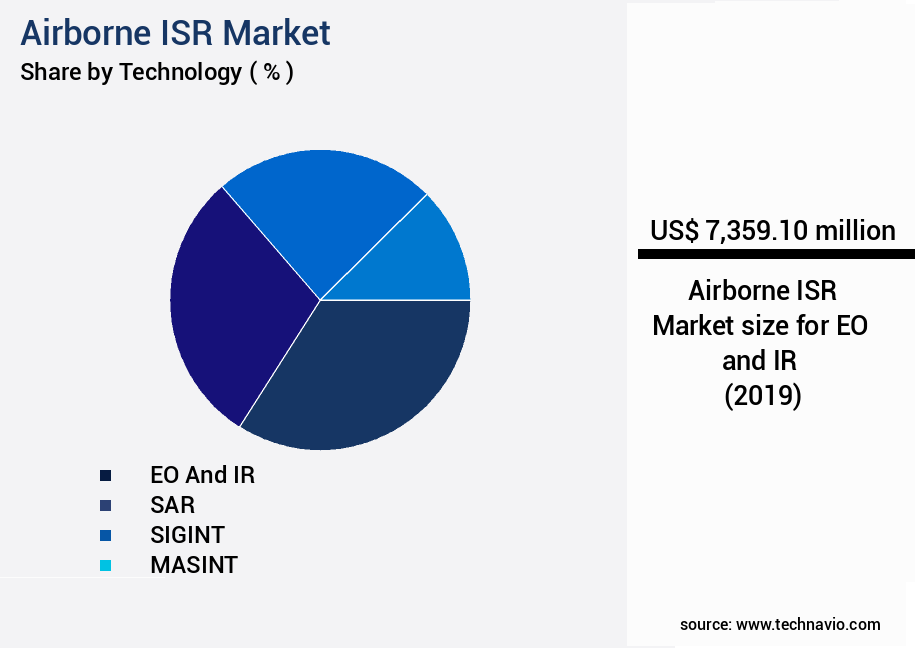
The EO and IR segment was valued at USD 7.36 billion in 2019 and showed a gradual increase during the forecast period.

Airborne ISR Market Size

Request Free Sample

Regional Analysis

North America is estimated to contribute 36% to the growth of the global market during the forecast period.Technavio's analysts have elaborately explained the regional trends and drivers that shape the market during the forecast period.

Airborne ISR Market Share by Geography

See How Airborne ISR Market Demand is Rising in North America Request Free Sample

The Airborne Intelligence, Surveillance, and Reconnaissance (ISR) market in North America is the global leader, driven by substantial defense budgets, advanced research and development, and a strategic focus on multi-domain operations. The United States dominates this landscape, with Canada providing crucial support, particularly in Arctic and maritime surveillance. This region's technological prowess is underscored by the US military's USD997 billion expenditure in 2024, representing a 5.7% year-over-year increase, according to the Stockholm International Peace Research Institute (SIPRI). Key applications include border security, disaster management, and military intelligence gathering. Airborne ISR technologies, such as unmanned aerial vehicles (UAVs) and high-altitude, long-endurance (HALE) platforms, offer operational efficiency gains and cost reductions compared to traditional manned aircraft.

For instance, UAVs can remain airborne for extended periods, reducing the need for multiple manned sorties. This market's dynamic nature is fueled by continuous innovation and the integration of emerging technologies, such as artificial intelligence and machine learning, to enhance ISR capabilities.

Market Dynamics

Our researchers analyzed the data with 2024 as the base year, along with the key drivers, trends, and challenges. A holistic analysis of drivers will help companies refine their marketing strategies to gain a competitive advantage.

The airborne ISR (Intelligence, Surveillance, and Reconnaissance) market is experiencing significant growth due to the increasing demand for real-time, high-resolution intelligence data from various industries and government agencies. Electro-optical infrared sensor integration in airborne platforms is a key trend in this market, enabling high-resolution aerial imagery processing and real-time data fusion for enhanced situational awareness. UAV (Unmanned Aerial Vehicle) payload capacity and endurance optimization are crucial factors in the development of advanced ISR systems. Synthetic aperture radar image interpretation techniques and hyperspectral imagery are gaining popularity for precision agriculture applications, while Lidar point cloud processing and 3D modeling workflows are essential for infrastructure assessment. Data analytics for improved target recognition and cybersecurity measures for airborne ISR systems are also critical components, ensuring reliable and secure data transmission and processing. Ground control station software for mission planning, communication network reliability for ISR operations, and image processing algorithms for object detection are essential for effective ISR system performance. Sensor calibration methods for accurate measurements and data visualization tools for effective decision-making are also important considerations. Advanced data fusion algorithms for enhanced intelligence, geospatial data analysis for infrastructure assessment, flight control systems for autonomous UAV operations, power management strategies for extended flight times, and thermal imaging applications in disaster monitoring are some of the latest developments in the market. Multispectral imaging for environmental monitoring is another area of significant growth, providing valuable data for industries such as agriculture, forestry, and mining. Overall, the market is poised for continued growth as the demand for real-time, high-resolution intelligence data increases across various industries and applications.

Airborne ISR Market Size

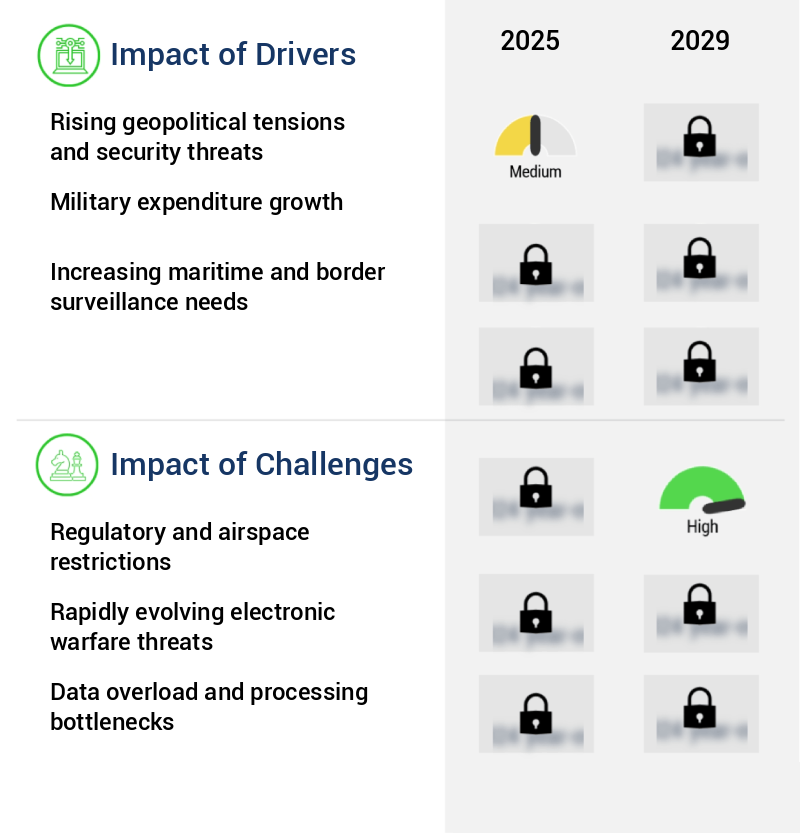
What are the key market drivers leading to the rise in the adoption of Airborne ISR Industry?

  • The escalating geopolitical tensions and security threats serve as the primary catalyst for market instability and growth. 
  • Airborne Intelligence, Surveillance, and Reconnaissance (ISR) systems have gained significant importance in today's complex geopolitical landscape. The increasing number of conflicts and security threats have underscored the strategic value of real-time intelligence gathering. According to recent studies, the global ISR market is experiencing robust growth, with a growing number of industries adopting these advanced technologies. For instance, the defense sector is investing heavily in advanced ISR platforms to monitor adversarial movements, track troop deployments, and maintain situational awareness in contested regions. The rise of asymmetric warfare and hybrid threats necessitates flexible ISR solutions capable of operating in dynamic and unpredictable environments.
  • Furthermore, border security concerns have also fueled ISR adoption. The integration of advanced sensors, artificial intelligence, and machine learning algorithms in ISR systems has led to significant improvements in accuracy and efficiency. For instance, some organizations have reported a reduction in downtime by up to 30%, enabling faster response times and more informed decision-making. 

What are the market trends shaping the Airborne ISR Industry?

  • Artificial intelligence and machine learning integration is becoming a prominent trend in the market. A growing number of businesses are adopting this technology to enhance their operations and gain a competitive edge.
  • Airborne Intelligence, Surveillance, and Reconnaissance (ISR) markets are undergoing significant transformation through the integration of artificial intelligence (AI) and machine learning (ML). Advanced Automated Target Recognition systems, utilizing AI and ML, classify military assets with over ninety percent accuracy, alleviating the cognitive burden on human analysts. Predictive analytics, driven by AI, correlate historical patterns with real-time sensor feeds, enabling mission planners to anticipate adversarial movements. A game-changer is AI-powered sensor fusion, which unifies data from multiple sources, including electro-optical/infrared cameras, synthetic aperture radar, signals intelligence intercepts, and LiDAR.
  • This capability enhances the detection of stealthy or camouflaged targets in complex environments, enabling platforms like the MQ-9 Reaper and U-2 to excel in denied or cluttered spaces. By reducing downtime and enhancing forecast accuracy, these advancements contribute to more effective and efficient airborne ISR operations.

What challenges does the Airborne ISR Industry face during its growth?

  • The growth of the industry is significantly impeded by regulatory and airspace restrictions, which pose a significant challenge. 
  • Airborne Intelligence, Surveillance, and Reconnaissance (ISR) capabilities have experienced significant evolution, driven by advancements in technology and increasing security needs. Unmanned aerial systems (UAS) and manned aircraft are key platforms for ISR applications, offering real-time intelligence and situational awareness. However, the global expansion of these capabilities faces challenges from complex regulatory frameworks and airspace restrictions. Operational uncertainty arises due to varying regulations across regions. For instance, NATO member states enforce stringent flight clearance protocols, while countries like China and Russia impose strict prohibitions on foreign surveillance near sensitive zones. Urban airspace restrictions, no-fly zones, and civil aviation safety requirements further limit ISR missions. Certification for beyond-line-of-sight drone operations remains a significant hurdle. Despite these challenges, the demand for airborne ISR continues to grow. 

Exclusive Technavio Analysis on Customer Landscape

The airborne isr market forecasting report includes the adoption lifecycle of the market, covering from the innovator's stage to the laggard's stage. It focuses on adoption rates in different regions based on penetration. Furthermore, the airborne isr market report also includes key purchase criteria and drivers of price sensitivity to help companies evaluate and develop their market growth analysis strategies.

Airborne ISR Market Share by Geography

 Customer Landscape of Airborne ISR Industry

Competitive Landscape

Companies are implementing various strategies, such as strategic alliances, airborne isr market forecast, partnerships, mergers and acquisitions, geographical expansion, and product/service launches, to enhance their presence in the industry.

Airbus SE - The company specializes in airborne Intelligence, Surveillance, and Reconnaissance (ISR) solutions, catering to diverse missions including special operations support, ground troop assistance, and target neutralization. These advanced ISR systems deliver critical real-time intelligence for enhanced situational awareness and operational success.

The industry research and growth report includes detailed analyses of the competitive landscape of the market and information about key companies, including:

  • Airbus SE
  • BAE Systems Plc
  • CACI International Inc.
  • Elbit Systems Ltd.
  • General Atomics
  • General Dynamics Corp.
  • Kratos Defense and Security Solutions Inc.
  • L3Harris Technologies Inc.
  • Leidos Holdings Inc.
  • Leonardo Spa
  • Lockheed Martin Corp.
  • Northrop Grumman Corp.
  • Rheinmetall AG
  • RTX Corp.
  • Saab AB
  • Safran SA
  • Teledyne FLIR LLC
  • Textron Inc.
  • Thales Group
  • The Boeing Co.

Qualitative and quantitative analysis of companies has been conducted to help clients understand the wider business environment as well as the strengths and weaknesses of key industry players. Data is qualitatively analyzed to categorize companies as pure play, category-focused, industry-focused, and diversified; it is quantitatively analyzed to categorize companies as dominant, leading, strong, tentative, and weak.

Recent Development and News in Airborne ISR Market

  • In January 2024, Lockheed Martin's subsidiary, Sikorsky, announced the successful first flight of the S-92® Airborne Intelligence, Surveillance, and Reconnaissance (ISR) helicopter, integrating advanced sensors and communication systems (Lockheed Martin Press Release).
  • In March 2024, Thales and Elbit Systems signed a strategic partnership to jointly develop and market Airborne Electronic Warfare (EW) systems for ISR platforms, combining Thales' EW expertise with Elbit's ISR capabilities (Thales Press Release).
  • In May 2024, Raytheon Technologies' subsidiary, Raytheon Intelligence & Space, secured a USD491 million contract from the U.S. Air Force for the production and delivery of MQ-1C Gray Eagle ER unmanned aerial vehicles, enhancing the Air Force's ISR capabilities (U.S. Department of Defense Press Release).
  • In August 2025, Israel Aerospace Industries (IAI) and Elbit Systems completed the integration of Elbit's multispectral E-MUSIC radar system onto IAI's Heron TP Mk II unmanned aerial vehicle, expanding its ISR capabilities and enhancing its market position (IAI Press Release).

Dive into Technavio's robust research methodology, blending expert interviews, extensive data synthesis, and validated models for unparalleled Airborne ISR Market insights. See full methodology.

Market Scope

Report Coverage

Details

Page number

238

Base year

2024

Historic period

2019-2023

Forecast period

2025-2029

Growth momentum & CAGR

Accelerate at a CAGR of 3.7%

Market growth 2025-2029

USD 5401.9 million

Market structure

Fragmented

YoY growth 2024-2025(%)

3.6

Key countries

US, China, Russia, Germany, UK, India, Saudi Arabia, Japan, France, and Ukraine

Competitive landscape

Leading Companies, Market Positioning of Companies, Competitive Strategies, and Industry Risks

Request Free Sample

Research Analyst Overview

  • The airborne Intelligence, Surveillance, and Reconnaissance (ISR) market continues to evolve, driven by advancements in technology and expanding applications across various sectors. Electro-optical sensors, equipped with infrared imaging systems and image processing software, are at the forefront of this evolution. High-altitude platforms, such as unmanned aerial vehicles (UAVs), provide a vantage point for real-time video streaming and data acquisition, enabling situation awareness in public safety and border security. Environmental monitoring is another growing application, with Lidar technology and synthetic aperture radar used for disaster monitoring and precision agriculture. Data fusion algorithms and data analytics play a crucial role in extracting valuable insights from the vast amounts of data generated.
  • Payload integration and mission planning software ensure optimal performance and efficiency. According to industry reports, the market is expected to grow by over 10% annually, fueled by the increasing demand for real-time intelligence gathering and object tracking. For instance, a leading public safety agency reported a 25% increase in situational awareness following the integration of advanced ISR capabilities into their operations. Cybersecurity protocols and communication networks are essential components of the airborne ISR ecosystem, ensuring secure data transmission and protection. Sensor calibration and data fusion are ongoing processes to maintain accuracy and reliability. Infrastructure inspection and reconnaissance missions are additional applications, providing valuable insights for maintenance and planning.
  • In summary, the market is a dynamic and evolving landscape, with ongoing advancements in technology and expanding applications across various sectors. The integration of electro-optical sensors, high-altitude platforms, and data analytics is transforming the way we gather and process information, driving growth and innovation in this market.

What are the Key Data Covered in this Airborne ISR Market Research and Growth Report?

  • What is the expected growth of the Airborne ISR Market between 2025 and 2029?

    • USD 5.4 billion, at a CAGR of 3.7%

  • What segmentation does the market report cover?

    • The report is segmented by Technology (EO and IR, SAR, SIGINT, MASINT, and Others), Vehicle Type (Unmanned airborne ISR and Manned airborne ISR), Application (Defense and military, Homeland security, and Civil and commercial), and Geography (North America, APAC, Europe, Middle East and Africa, and South America)

  • Which regions are analyzed in the report?

    • North America, APAC, Europe, Middle East and Africa, and South America

  • What are the key growth drivers and market challenges?

    • Rising geopolitical tensions and security threats, Regulatory and airspace restrictions

  • Who are the major players in the Airborne ISR Market?

    • Airbus SE, BAE Systems Plc, CACI International Inc., Elbit Systems Ltd., General Atomics, General Dynamics Corp., Kratos Defense and Security Solutions Inc., L3Harris Technologies Inc., Leidos Holdings Inc., Leonardo Spa, Lockheed Martin Corp., Northrop Grumman Corp., Rheinmetall AG, RTX Corp., Saab AB, Safran SA, Teledyne FLIR LLC, Textron Inc., Thales Group, and The Boeing Co.

Market Research Insights

  • The market is a dynamic and ever-evolving industry, characterized by continuous advancements in technology and increasing demand for real-time intelligence. Two key statistics highlight the market's growth and significance. First, the number of sensor deployments has risen by 20% over the past five years, enabling more extensive coverage and improved data accuracy. Second, industry analysts anticipate a compound annual growth rate of 15% in the coming years, driven by the expanding applications of airborne ISR in sectors such as defense, agriculture, and environmental monitoring.
  • An example of the market's impact can be seen in the increased sales of object detection systems for traffic management, resulting in a 30% reduction in traffic congestion in major cities.

We can help! Our analysts can customize this airborne isr market research report to meet your requirements.

Get in touch

1 Executive Summary

  • 1.1 Market overview
    • Executive Summary - Chart on Market Overview
    • Executive Summary - Data Table on Market Overview
    • Executive Summary - Chart on Global Market Characteristics
    • Executive Summary - Chart on Market by Geography
    • Executive Summary - Chart on Market Segmentation by Technology
    • Executive Summary - Chart on Market Segmentation by Vehicle Type
    • Executive Summary - Chart on Market Segmentation by Application
    • Executive Summary - Chart on Incremental Growth
    • Executive Summary - Data Table on Incremental Growth
    • Executive Summary - Chart on Company Market Positioning

2 Technavio Analysis

  • 2.1 Analysis of price sensitivity, lifecycle, customer purchase basket, adoption rates, and purchase criteria
    • Analysis of price sensitivity, lifecycle, customer purchase basket, adoption rates, and purchase criteria
  • 2.2 Criticality of inputs and Factors of differentiation
    • Overview on criticality of inputs and factors of differentiation
  • 2.3 Factors of disruption
    • Overview on factors of disruption
  • 2.4 Impact of drivers and challenges
    • Impact of drivers and challenges in 2024 and 2029

3 Market Landscape

  • 3.1 Market ecosystem
    • Parent Market
    • Data Table on - Parent Market
  • 3.2 Market characteristics
    • Market characteristics analysis
  • 3.3 Value chain analysis
    • Value chain analysis

4 Market Sizing

  • 4.1 Market definition
    • Offerings of companies included in the market definition
  • 4.2 Market segment analysis
    • Market segments
  • 4.3 Market size 2024
    • 4.4 Market outlook: Forecast for 2024-2029
      • Chart on Global - Market size and forecast 2024-2029 ($ million)
      • Data Table on Global - Market size and forecast 2024-2029 ($ million)
      • Chart on Global Market: Year-over-year growth 2024-2029 (%)
      • Data Table on Global Market: Year-over-year growth 2024-2029 (%)

    5 Historic Market Size

    • 5.1 Global Airborne ISR Market 2019 - 2023
      • Historic Market Size - Data Table on Global Airborne ISR Market 2019 - 2023 ($ million)
    • 5.2 Technology segment analysis 2019 - 2023
      • Historic Market Size - Technology Segment 2019 - 2023 ($ million)
    • 5.3 Vehicle Type segment analysis 2019 - 2023
      • Historic Market Size - Vehicle Type Segment 2019 - 2023 ($ million)
    • 5.4 Application segment analysis 2019 - 2023
      • Historic Market Size - Application Segment 2019 - 2023 ($ million)
    • 5.5 Geography segment analysis 2019 - 2023
      • Historic Market Size - Geography Segment 2019 - 2023 ($ million)
    • 5.6 Country segment analysis 2019 - 2023
      • Historic Market Size - Country Segment 2019 - 2023 ($ million)

    6 Qualitative Analysis

    • 6.1 Impact Analysis of U.S. Tariffs on Global Airborne ISR Market

      7 Five Forces Analysis

      • 7.1 Five forces summary
        • Five forces analysis - Comparison between 2024 and 2029
      • 7.2 Bargaining power of buyers
        • Bargaining power of buyers - Impact of key factors 2024 and 2029
      • 7.3 Bargaining power of suppliers
        • Bargaining power of suppliers - Impact of key factors in 2024 and 2029
      • 7.4 Threat of new entrants
        • Threat of new entrants - Impact of key factors in 2024 and 2029
      • 7.5 Threat of substitutes
        • Threat of substitutes - Impact of key factors in 2024 and 2029
      • 7.6 Threat of rivalry
        • Threat of rivalry - Impact of key factors in 2024 and 2029
      • 7.7 Market condition
        • Chart on Market condition - Five forces 2024 and 2029

      8 Market Segmentation by Technology

      • 8.1 Market segments
        • Chart on Technology - Market share 2024-2029 (%)
        • Data Table on Technology - Market share 2024-2029 (%)
      • 8.2 Comparison by Technology
        • Chart on Comparison by Technology
        • Data Table on Comparison by Technology
      • 8.3 EO and IR - Market size and forecast 2024-2029
        • Chart on EO and IR - Market size and forecast 2024-2029 ($ million)
        • Data Table on EO and IR - Market size and forecast 2024-2029 ($ million)
        • Chart on EO and IR - Year-over-year growth 2024-2029 (%)
        • Data Table on EO and IR - Year-over-year growth 2024-2029 (%)
      • 8.4 SAR - Market size and forecast 2024-2029
        • Chart on SAR - Market size and forecast 2024-2029 ($ million)
        • Data Table on SAR - Market size and forecast 2024-2029 ($ million)
        • Chart on SAR - Year-over-year growth 2024-2029 (%)
        • Data Table on SAR - Year-over-year growth 2024-2029 (%)
      • 8.5 SIGINT - Market size and forecast 2024-2029
        • Chart on SIGINT - Market size and forecast 2024-2029 ($ million)
        • Data Table on SIGINT - Market size and forecast 2024-2029 ($ million)
        • Chart on SIGINT - Year-over-year growth 2024-2029 (%)
        • Data Table on SIGINT - Year-over-year growth 2024-2029 (%)
      • 8.6 MASINT - Market size and forecast 2024-2029
        • Chart on MASINT - Market size and forecast 2024-2029 ($ million)
        • Data Table on MASINT - Market size and forecast 2024-2029 ($ million)
        • Chart on MASINT - Year-over-year growth 2024-2029 (%)
        • Data Table on MASINT - Year-over-year growth 2024-2029 (%)
      • 8.7 Others - Market size and forecast 2024-2029
        • Chart on Others - Market size and forecast 2024-2029 ($ million)
        • Data Table on Others - Market size and forecast 2024-2029 ($ million)
        • Chart on Others - Year-over-year growth 2024-2029 (%)
        • Data Table on Others - Year-over-year growth 2024-2029 (%)
      • 8.8 Market opportunity by Technology
        • Market opportunity by Technology ($ million)
        • Data Table on Market opportunity by Technology ($ million)

      9 Market Segmentation by Vehicle Type

      • 9.1 Market segments
        • Chart on Vehicle Type - Market share 2024-2029 (%)
        • Data Table on Vehicle Type - Market share 2024-2029 (%)
      • 9.2 Comparison by Vehicle Type
        • Chart on Comparison by Vehicle Type
        • Data Table on Comparison by Vehicle Type
      • 9.3 Unmanned airborne ISR - Market size and forecast 2024-2029
        • Chart on Unmanned airborne ISR - Market size and forecast 2024-2029 ($ million)
        • Data Table on Unmanned airborne ISR - Market size and forecast 2024-2029 ($ million)
        • Chart on Unmanned airborne ISR - Year-over-year growth 2024-2029 (%)
        • Data Table on Unmanned airborne ISR - Year-over-year growth 2024-2029 (%)
      • 9.4 Manned airborne ISR - Market size and forecast 2024-2029
        • Chart on Manned airborne ISR - Market size and forecast 2024-2029 ($ million)
        • Data Table on Manned airborne ISR - Market size and forecast 2024-2029 ($ million)
        • Chart on Manned airborne ISR - Year-over-year growth 2024-2029 (%)
        • Data Table on Manned airborne ISR - Year-over-year growth 2024-2029 (%)
      • 9.5 Market opportunity by Vehicle Type
        • Market opportunity by Vehicle Type ($ million)
        • Data Table on Market opportunity by Vehicle Type ($ million)

      10 Market Segmentation by Application

      • 10.1 Market segments
        • Chart on Application - Market share 2024-2029 (%)
        • Data Table on Application - Market share 2024-2029 (%)
      • 10.2 Comparison by Application
        • Chart on Comparison by Application
        • Data Table on Comparison by Application
      • 10.3 Defense and military - Market size and forecast 2024-2029
        • Chart on Defense and military - Market size and forecast 2024-2029 ($ million)
        • Data Table on Defense and military - Market size and forecast 2024-2029 ($ million)
        • Chart on Defense and military - Year-over-year growth 2024-2029 (%)
        • Data Table on Defense and military - Year-over-year growth 2024-2029 (%)
      • 10.4 Homeland security - Market size and forecast 2024-2029
        • Chart on Homeland security - Market size and forecast 2024-2029 ($ million)
        • Data Table on Homeland security - Market size and forecast 2024-2029 ($ million)
        • Chart on Homeland security - Year-over-year growth 2024-2029 (%)
        • Data Table on Homeland security - Year-over-year growth 2024-2029 (%)
      • 10.5 Civil and commercial - Market size and forecast 2024-2029
        • Chart on Civil and commercial - Market size and forecast 2024-2029 ($ million)
        • Data Table on Civil and commercial - Market size and forecast 2024-2029 ($ million)
        • Chart on Civil and commercial - Year-over-year growth 2024-2029 (%)
        • Data Table on Civil and commercial - Year-over-year growth 2024-2029 (%)
      • 10.6 Market opportunity by Application
        • Market opportunity by Application ($ million)
        • Data Table on Market opportunity by Application ($ million)

      11 Customer Landscape

      • 11.1 Customer landscape overview
        • Analysis of price sensitivity, lifecycle, customer purchase basket, adoption rates, and purchase criteria

      12 Geographic Landscape

      • 12.1 Geographic segmentation
        • Chart on Market share by geography 2024-2029 (%)
        • Data Table on Market share by geography 2024-2029 (%)
      • 12.2 Geographic comparison
        • Chart on Geographic comparison
        • Data Table on Geographic comparison
      • 12.3 North America - Market size and forecast 2024-2029
        • Chart on North America - Market size and forecast 2024-2029 ($ million)
        • Data Table on North America - Market size and forecast 2024-2029 ($ million)
        • Chart on North America - Year-over-year growth 2024-2029 (%)
        • Data Table on North America - Year-over-year growth 2024-2029 (%)
      • 12.4 APAC - Market size and forecast 2024-2029
        • Chart on APAC - Market size and forecast 2024-2029 ($ million)
        • Data Table on APAC - Market size and forecast 2024-2029 ($ million)
        • Chart on APAC - Year-over-year growth 2024-2029 (%)
        • Data Table on APAC - Year-over-year growth 2024-2029 (%)
      • 12.5 Europe - Market size and forecast 2024-2029
        • Chart on Europe - Market size and forecast 2024-2029 ($ million)
        • Data Table on Europe - Market size and forecast 2024-2029 ($ million)
        • Chart on Europe - Year-over-year growth 2024-2029 (%)
        • Data Table on Europe - Year-over-year growth 2024-2029 (%)
      • 12.6 Middle East and Africa - Market size and forecast 2024-2029
        • Chart on Middle East and Africa - Market size and forecast 2024-2029 ($ million)
        • Data Table on Middle East and Africa - Market size and forecast 2024-2029 ($ million)
        • Chart on Middle East and Africa - Year-over-year growth 2024-2029 (%)
        • Data Table on Middle East and Africa - Year-over-year growth 2024-2029 (%)
      • 12.7 South America - Market size and forecast 2024-2029
        • Chart on South America - Market size and forecast 2024-2029 ($ million)
        • Data Table on South America - Market size and forecast 2024-2029 ($ million)
        • Chart on South America - Year-over-year growth 2024-2029 (%)
        • Data Table on South America - Year-over-year growth 2024-2029 (%)
      • 12.8 US - Market size and forecast 2024-2029
        • Chart on US - Market size and forecast 2024-2029 ($ million)
        • Data Table on US - Market size and forecast 2024-2029 ($ million)
        • Chart on US - Year-over-year growth 2024-2029 (%)
        • Data Table on US - Year-over-year growth 2024-2029 (%)
      • 12.9 China - Market size and forecast 2024-2029
        • Chart on China - Market size and forecast 2024-2029 ($ million)
        • Data Table on China - Market size and forecast 2024-2029 ($ million)
        • Chart on China - Year-over-year growth 2024-2029 (%)
        • Data Table on China - Year-over-year growth 2024-2029 (%)
      • 12.10 Russia - Market size and forecast 2024-2029
        • Chart on Russia - Market size and forecast 2024-2029 ($ million)
        • Data Table on Russia - Market size and forecast 2024-2029 ($ million)
        • Chart on Russia - Year-over-year growth 2024-2029 (%)
        • Data Table on Russia - Year-over-year growth 2024-2029 (%)
      • 12.11 Germany - Market size and forecast 2024-2029
        • Chart on Germany - Market size and forecast 2024-2029 ($ million)
        • Data Table on Germany - Market size and forecast 2024-2029 ($ million)
        • Chart on Germany - Year-over-year growth 2024-2029 (%)
        • Data Table on Germany - Year-over-year growth 2024-2029 (%)
      • 12.12 India - Market size and forecast 2024-2029
        • Chart on India - Market size and forecast 2024-2029 ($ million)
        • Data Table on India - Market size and forecast 2024-2029 ($ million)
        • Chart on India - Year-over-year growth 2024-2029 (%)
        • Data Table on India - Year-over-year growth 2024-2029 (%)
      • 12.13 UK - Market size and forecast 2024-2029
        • Chart on UK - Market size and forecast 2024-2029 ($ million)
        • Data Table on UK - Market size and forecast 2024-2029 ($ million)
        • Chart on UK - Year-over-year growth 2024-2029 (%)
        • Data Table on UK - Year-over-year growth 2024-2029 (%)
      • 12.14 Saudi Arabia - Market size and forecast 2024-2029
        • Chart on Saudi Arabia - Market size and forecast 2024-2029 ($ million)
        • Data Table on Saudi Arabia - Market size and forecast 2024-2029 ($ million)
        • Chart on Saudi Arabia - Year-over-year growth 2024-2029 (%)
        • Data Table on Saudi Arabia - Year-over-year growth 2024-2029 (%)
      • 12.15 Ukraine - Market size and forecast 2024-2029
        • Chart on Ukraine - Market size and forecast 2024-2029 ($ million)
        • Data Table on Ukraine - Market size and forecast 2024-2029 ($ million)
        • Chart on Ukraine - Year-over-year growth 2024-2029 (%)
        • Data Table on Ukraine - Year-over-year growth 2024-2029 (%)
      • 12.16 France - Market size and forecast 2024-2029
        • Chart on France - Market size and forecast 2024-2029 ($ million)
        • Data Table on France - Market size and forecast 2024-2029 ($ million)
        • Chart on France - Year-over-year growth 2024-2029 (%)
        • Data Table on France - Year-over-year growth 2024-2029 (%)
      • 12.17 Japan - Market size and forecast 2024-2029
        • Chart on Japan - Market size and forecast 2024-2029 ($ million)
        • Data Table on Japan - Market size and forecast 2024-2029 ($ million)
        • Chart on Japan - Year-over-year growth 2024-2029 (%)
        • Data Table on Japan - Year-over-year growth 2024-2029 (%)
      • 12.18 Market opportunity by geography
        • Market opportunity by geography ($ million)
        • Data Tables on Market opportunity by geography ($ million)

      13 Drivers, Challenges, and Opportunity/Restraints

      • 13.1 Market drivers
        • 13.2 Market challenges
          • 13.3 Impact of drivers and challenges
            • Impact of drivers and challenges in 2024 and 2029
          • 13.4 Market opportunities/restraints

            14 Competitive Landscape

            • 14.1 Overview
              • 14.2 Competitive Landscape
                • Overview on criticality of inputs and factors of differentiation
              • 14.3 Landscape disruption
                • Overview on factors of disruption
              • 14.4 Industry risks
                • Impact of key risks on business

              15 Competitive Analysis

              • 15.1 Companies profiled
                • Companies covered
              • 15.2 Company ranking index
                • Company ranking index
              • 15.3 Market positioning of companies
                • Matrix on companies position and classification
              • 15.4 Airbus SE
                • Airbus SE - Overview
                • Airbus SE - Business segments
                • Airbus SE - Key news
                • Airbus SE - Key offerings
                • Airbus SE - Segment focus
                • SWOT
              • 15.5 BAE Systems Plc
                • BAE Systems Plc - Overview
                • BAE Systems Plc - Business segments
                • BAE Systems Plc - Key news
                • BAE Systems Plc - Key offerings
                • BAE Systems Plc - Segment focus
                • SWOT
              • 15.6 Elbit Systems Ltd.
                • Elbit Systems Ltd. - Overview
                • Elbit Systems Ltd. - Product / Service
                • Elbit Systems Ltd. - Key news
                • Elbit Systems Ltd. - Key offerings
                • SWOT
              • 15.7 General Atomics
                • General Atomics - Overview
                • General Atomics - Product / Service
                • General Atomics - Key offerings
                • SWOT
              • 15.8 General Dynamics Corp.
                • General Dynamics Corp. - Overview
                • General Dynamics Corp. - Business segments
                • General Dynamics Corp. - Key news
                • General Dynamics Corp. - Key offerings
                • General Dynamics Corp. - Segment focus
                • SWOT
              • 15.9 Kratos Defense and Security Solutions Inc.
                • Kratos Defense and Security Solutions Inc. - Overview
                • Kratos Defense and Security Solutions Inc. - Business segments
                • Kratos Defense and Security Solutions Inc. - Key offerings
                • Kratos Defense and Security Solutions Inc. - Segment focus
                • SWOT
              • 15.10 L3Harris Technologies Inc.
                • L3Harris Technologies Inc. - Overview
                • L3Harris Technologies Inc. - Business segments
                • L3Harris Technologies Inc. - Key news
                • L3Harris Technologies Inc. - Key offerings
                • L3Harris Technologies Inc. - Segment focus
                • SWOT
              • 15.11 Leonardo Spa
                • Leonardo Spa - Overview
                • Leonardo Spa - Business segments
                • Leonardo Spa - Key offerings
                • Leonardo Spa - Segment focus
                • SWOT
              • 15.12 Lockheed Martin Corp.
                • Lockheed Martin Corp. - Overview
                • Lockheed Martin Corp. - Business segments
                • Lockheed Martin Corp. - Key news
                • Lockheed Martin Corp. - Key offerings
                • Lockheed Martin Corp. - Segment focus
                • SWOT
              • 15.13 Northrop Grumman Corp.
                • Northrop Grumman Corp. - Overview
                • Northrop Grumman Corp. - Business segments
                • Northrop Grumman Corp. - Key news
                • Northrop Grumman Corp. - Key offerings
                • Northrop Grumman Corp. - Segment focus
                • SWOT
              • 15.14 RTX Corp.
                • RTX Corp. - Overview
                • RTX Corp. - Business segments
                • RTX Corp. - Key news
                • RTX Corp. - Key offerings
                • RTX Corp. - Segment focus
                • SWOT
              • 15.15 Teledyne FLIR LLC
                • Teledyne FLIR LLC - Overview
                • Teledyne FLIR LLC - Product / Service
                • Teledyne FLIR LLC - Key offerings
                • SWOT
              • 15.16 Textron Inc.
                • Textron Inc. - Overview
                • Textron Inc. - Business segments
                • Textron Inc. - Key offerings
                • Textron Inc. - Segment focus
                • SWOT
              • 15.17 Thales Group
                • Thales Group - Overview
                • Thales Group - Business segments
                • Thales Group - Key news
                • Thales Group - Key offerings
                • Thales Group - Segment focus
                • SWOT
              • 15.18 The Boeing Co.
                • The Boeing Co. - Overview
                • The Boeing Co. - Business segments
                • The Boeing Co. - Key news
                • The Boeing Co. - Key offerings
                • The Boeing Co. - Segment focus
                • SWOT

              16 Appendix

              • 16.1 Scope of the report
                • 16.2 Inclusions and exclusions checklist
                  • Inclusions checklist
                  • Exclusions checklist
                • 16.3 Currency conversion rates for US$
                  • Currency conversion rates for US$
                • 16.4 Research methodology
                  • Research methodology
                • 16.5 Data procurement
                  • Information sources
                • 16.6 Data validation
                  • Data validation
                • 16.7 Validation techniques employed for market sizing
                  • Validation techniques employed for market sizing
                • 16.8 Data synthesis
                  • Data synthesis
                • 16.9 360 degree market analysis
                  • 360 degree market analysis
                • 16.10 List of abbreviations
                  • List of abbreviations

                Research Methodology

                Technavio presents a detailed picture of the market by way of study, synthesis, and summation of data from multiple sources. The analysts have presented the various facets of the market with a particular focus on identifying the key industry influencers. The data thus presented is comprehensive, reliable, and the result of extensive research, both primary and secondary.

                INFORMATION SOURCES

                Primary sources

                • Manufacturers and suppliers
                • Channel partners
                • Industry experts
                • Strategic decision makers

                Secondary sources

                • Industry journals and periodicals
                • Government data
                • Financial reports of key industry players
                • Historical data
                • Press releases

                DATA ANALYSIS

                Data Synthesis

                • Collation of data
                • Estimation of key figures
                • Analysis of derived insights

                Data Validation

                • Triangulation with data models
                • Reference against proprietary databases
                • Corroboration with industry experts

                REPORT WRITING

                Qualitative

                • Market drivers
                • Market challenges
                • Market trends
                • Five forces analysis

                Quantitative

                • Market size and forecast
                • Market segmentation
                • Geographical insights
                • Competitive landscape

                Interested in this report?

                Get your sample now to see our research methodology and insights!

                Download Now

                Frequently Asked Questions

                Airborne Isr market growth will increase by $ 5401.9 mn during 2025-2029.

                The Airborne Isr market is expected to grow at a CAGR of 3.7% during 2025-2029.

                Airborne Isr market is segmented by Technology( EO and IR, SAR, SIGINT, MASINT, Others) Vehicle Type( Unmanned airborne ISR, Manned airborne ISR, Europe, MEA, South America) Application( Defense and military, Homeland security, Civil and commercial, MEA, South America)

                Airbus SE, BAE Systems Plc, CACI International Inc., Elbit Systems Ltd., General Atomics, General Dynamics Corp., Kratos Defense and Security Solutions Inc., L3Harris Technologies Inc., Leidos Holdings Inc., Leonardo Spa, Lockheed Martin Corp., Northrop Grumman Corp., Rheinmetall AG, RTX Corp., Saab AB, Safran SA, Teledyne FLIR LLC, Textron Inc., Thales Group, The Boeing Co. are a few of the key vendors in the Airborne Isr market.

                North America will register the highest growth rate of 36% among the other regions. Therefore, the Airborne Isr market in North America is expected to garner significant business opportunities for the vendors during the forecast period.

                US, China, Russia, Germany, UK, India, Saudi Arabia, Japan, France, Ukraine

                • Rising geopolitical tensions and security threatsEscalating geopolitical tensions and evolving security threats are driving increased demand for airborne intelligence is the driving factor this market.
                • surveillance is the driving factor this market.
                • and reconnaissance systems. Ongoing conflicts such as the Russia-Ukraine war and persistent instability in the Middle East have underscored the strategic importance of real-time intelligence gathering. Governments are investing in advanced ISR platforms to monitor adversarial movements is the driving factor this market.
                • track troop deployments is the driving factor this market.
                • and maintain situational awareness across contested regions. The rise of asymmetric warfare is the driving factor this market.
                • including insurgent activity and hybrid threats is the driving factor this market.
                • has further intensified the need for persistent aerial surveillance. These unconventional tactics require flexible ISR solutions capable of operating in dynamic and unpredictable environments. Border security concerns are also contributing to ISR adoption. Nations facing challenges related to illegal migration is the driving factor this market.
                • cross-border terrorism is the driving factor this market.
                • drug trafficking is the driving factor this market.
                • and territorial disputes particularly in the Indo-Pacific is the driving factor this market.
                • Eastern Europe is the driving factor this market.
                • and along the U.S.-Mexico border are deploying ISR assets to monitor remote and expansive areas. Platforms such as the MQ-9 Reaper and Eurodrone are being utilized for long-endurance border patrol missions is the driving factor this market.
                • while countries like India and China are enhancing ISR capabilities to secure contested zones such as the Line of Actual Control. The growing threat of near-peer conflicts has led to increased demand for electronic warfare and signals intelligence-enabled ISR systems. Adversaries are employing jamming and spoofing techniques is the driving factor this market.
                • prompting militaries to integrate countermeasures and sensor fusion technologies. The emphasis on multi-domain operations spanning air is the driving factor this market.
                • land is the driving factor this market.
                • sea is the driving factor this market.
                • and cyber has positioned ISR as a cornerstone of modern defense strategies. As rivalries intensify is the driving factor this market.
                • airborne ISR platforms are becoming essential tools for maintaining strategic superiority and operational readiness. is the driving factor this market.

                The Airborne Isr market vendors should focus on grabbing business opportunities from the EO and IR segment as it accounted for the largest market share in the base year.