Air Freight Services Market Size 2025-2029
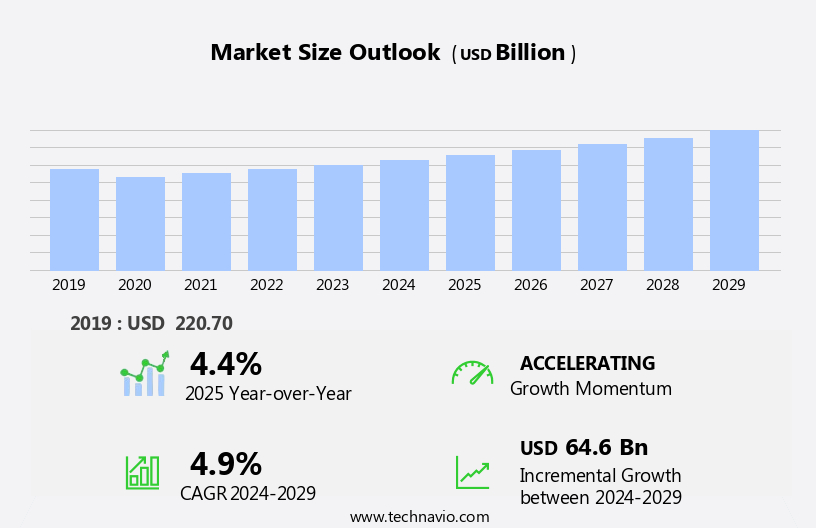
The air freight services market size is forecast to increase by USD 64.6 billion at a CAGR of 4.9% between 2024 and 2029.
- The market is experiencing significant growth, driven primarily by the increase in cross-border e-commerce activities. The increasing trend of online shopping and the subsequent rise in international deliveries have led to a substantial increase in demand for air freight services. Additionally, the adoption of advanced technologies such as blockchain is revolutionizing the industry by enhancing security, transparency, and efficiency. However, the high cost of availing air freight services remains a significant challenge for market growth. Despite this, companies can capitalize on the opportunities presented by this market by offering competitive pricing, focusing on niche markets, and implementing technology solutions to streamline operations and reduce costs. Overall, the market offers substantial growth potential for investors and businesses seeking to capitalize on the increasing demand for fast and reliable international delivery solutions.
What will be the Size of the Market during the forecast period?
- The market, a significant segment of the global logistics industry, continues to evolve with advancements in technology and increasing demand for efficient and expedited shipping solutions. Key trends shaping the market include the integration of cool-chain systems for temperature-sensitive goods, the adoption of robotics, automation, and artificial intelligence (AI) for enhanced aircraft operations, and the utilization of big data, deep learning, Internet of Things (IoT), augmented reality, and virtual reality for optimized freight management and tracking.
- The air cargo industry's growth is driven by the need for high-speed shipments, particularly in sectors such as electronics, pharmaceuticals, and perishables. Freighter flights are increasingly popular for time-sensitive and large-volume consignments, contributing to the market's expansion. Overall, the air freight industry remains a dynamic and innovative sector, continually adapting to meet the evolving needs of global trade.
How is this Industry segmented?
The industry research report provides comprehensive data (region-wise segment analysis), with forecasts and estimates in "USD billion" for the period 2025-2029, as well as historical data from 2019-2023 for the following segments.
- Type
- International
- Domestic
- End-user
- Manufacturing
- Retail
- Others
- Product Type
- General cargo
- Perishable cargo
- Dangerous cargo
- High-value cargo
- Geography
- APAC
- Australia
- China
- India
- Japan
- South Korea
- North America
- US
- Canada
- Europe
- France
- Germany
- UK
- Middle East and Africa
- South America
- APAC
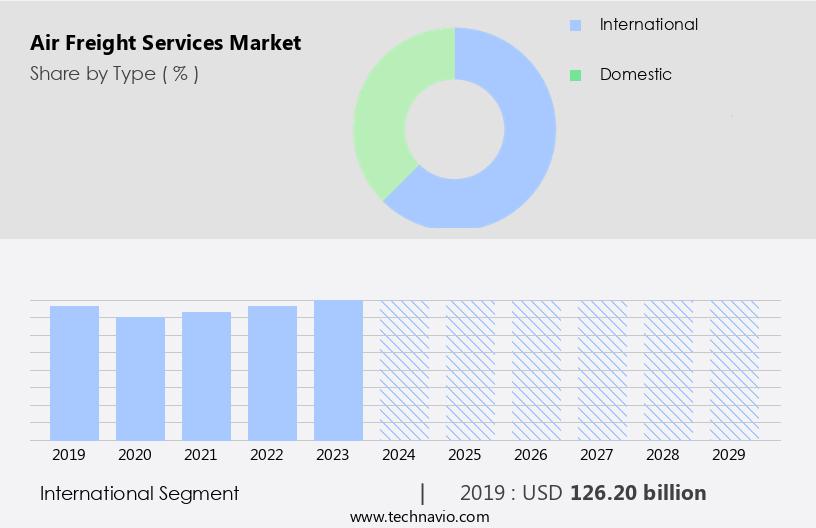
By Type Insights
The international segment is estimated to witness significant growth during the forecast period. Air freight services have gained significant importance in the logistics industry due to the increasing globalization of trade and the e-commerce boom. Companies expanding their global reach require efficient and reliable air freight services to transport goods between continents. Technological advances and logistics management systems have enhanced the efficiency and dependability of international air freight services, offering real-time tracking, automated customs clearing processes, and improved route planning. These advancements have reduced transit times and increased overall service quality, making air freight the preferred choice for time-sensitive cargo. The rise of online shopping and cross-border e-commerce has further fueled the demand for international air cargo services, necessitating fast delivery of goods to customers worldwide.
Get a glance at the market report of share of various segments Request Free Sample
The international segment was valued at USD 126.20 billion in 2019 and showed a gradual increase during the forecast period.
Regional Analysis
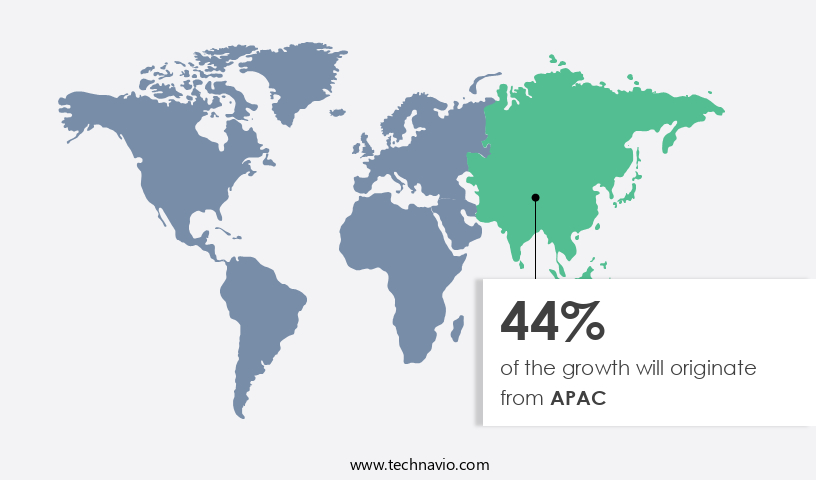
APAC is estimated to contribute 44% to the growth of the global market during the forecast period.Technavio's analysts have elaborately explained the regional trends and drivers that shape the market during the forecast period.
For more insights on the market size of various regions, Request Free Sample
The market in Asia Pacific (APAC) is experiencing significant growth due to the increase in cross-border e-commerce, particularly in countries like China, India, and Japan. The e-commerce sector's expansion is driven by the convenience and speed it offers, which has been further accelerated by the pandemic. This trend is expected to boost the growth of the regional the market. According to the Association of Asia Pacific Airlines, the number of foreign passengers transported by APAC airlines increased by 49.4% in January 2024 compared to the previous year, reaching 27 million. These play a crucial role in the logistics industry, particularly for the transportation of valuable, perishable goods, high-end electronics, and automobile components.
Market Dynamics
Our researchers analyzed the data with 2024 as the base year, along with the key drivers, trends, and challenges. A holistic analysis of drivers will help companies refine their marketing strategies to gain a competitive advantage.
What are the key market drivers leading to the rise in the adoption of Industry?
- Rising demand driven by increase in cross-border e-commerce activities is the key driver of the market. Cross-border e-commerce has witnessed notable growth over the past decade, enabling customers to purchase goods from outside their domestic markets. This trend is particularly prominent in countries such as China, Singapore, Indonesia, Australia, France, Mexico, and India, which are significant players in global exports of various product categories.
- For instance, China, India, and the European Union are leading exporters of clothing, while France and the US dominate the beauty and personal care product market. The increasing popularity of business-to-business (B2B) and business-to-consumer (B2C) online marketplaces has facilitated seamless transactions across borders. Cross-border e-commerce activities offer numerous benefits, including expanded market reach, increased competition, and improved customer experience. This growth dynamic is expected to continue, offering lucrative opportunities for businesses looking to expand their footprint in international markets.
What are the market trends shaping the Industry?
- Growing adoption of blockchain in air freight services is the upcoming market trend. Air freight services have experienced significant advancements, with blockchain technology playing a pivotal role in enhancing their efficiency and cost savings. Traditionally, the transfer of information from Original Equipment Manufacturers (OEMs) to third-party air freight service providers involved intricate interface setups, leading to time-consuming and error-prone processes.
- Blockchain technology, a distributed ledger system, addresses these challenges by providing a secure and transparent platform for recording digital transactions. By implementing blockchain, air freight service providers can streamline their operations, ensuring improved data visibility and security throughout the supply chain. This innovative technology offers numerous benefits, including increased operational efficiency, reduced errors, and enhanced trust among stakeholders. With the potential to revolutionize the air freight industry, the adoption of blockchain technology is poised to bring about a new era of seamless and secure business transactions.
What challenges does the Industry face during its growth?
- High cost of availing air freight services is a key challenge affecting the industry growth. Air freight services cater to the transportation of high-value goods requiring swift delivery. Buyers receive quotations for all modes of transportation, with air freight being the most expensive. For example, shipping 1,000 pounds of goods from Hong Kong to Delaware via air with FedEx costs approximately USD13,000, compared to USD3,000 for sea freight.
- Major components contributing to air freight costs include jet fuel surcharges, transportation expenses, labor and handling fees, customs brokerage, and landing charges. Despite the high costs, air freight remains a preferred option for businesses due to its speed and reliability. High labor cost also increases air freight costs. Labor costs are high in North America and Europe. For instance, labor costs account for over one-fourth of the total air freight cost in these regions. The global shortage of workers and scarcity of qualified pilots is increasing labor costs. Owing to the rise in air freight costs, most end-users such as e-commerce companies and other manufacturers settle for marine or land transportation, which hinders the growth of the global market during the forecast period.
Exclusive Customer Landscape
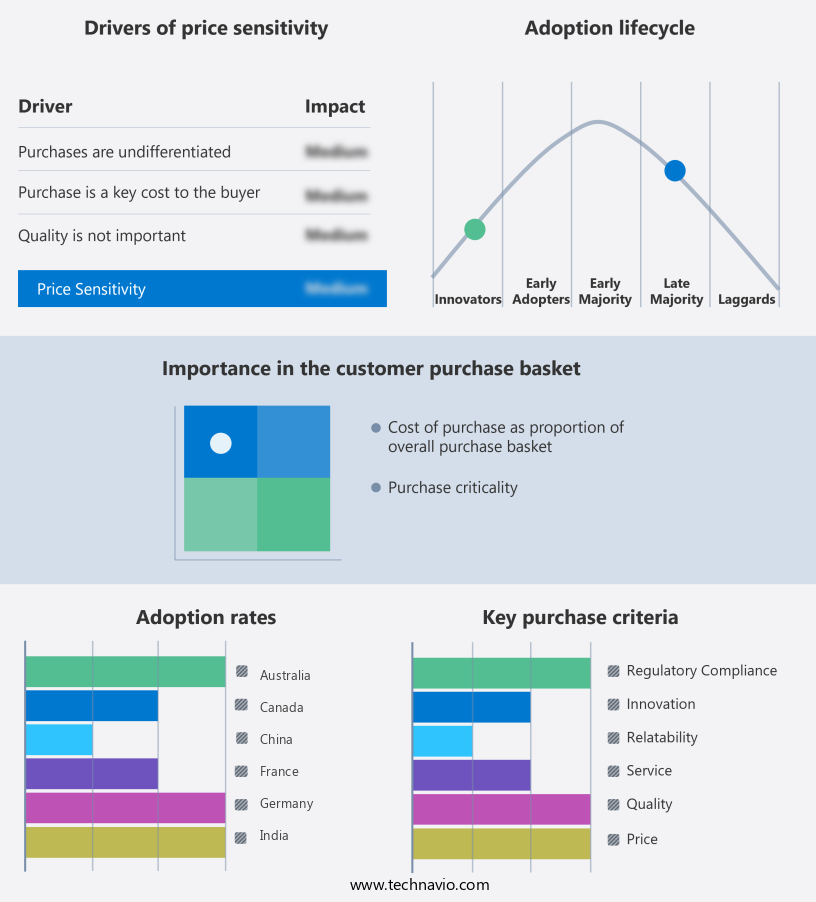
The market forecasting report includes the adoption lifecycle of the market, covering from the innovator's stage to the laggard's stage. It focuses on adoption rates in different regions based on penetration. Furthermore, the market report also includes key purchase criteria and drivers of price sensitivity to help companies evaluate and develop their market growth analysis strategies.
Customer Landscape
Key Companies & Market Insights
Companies are implementing various strategies, such as strategic alliances, market forecast, partnerships, mergers and acquisitions, geographical expansion, and product/service launches, to enhance their presence in the industry.
Agility Public Warehousing Co. K.S.C.P - The company offers air freight services such as digitally enabled freight forwarding through the Shipa Freight online logistics platform.
The industry research and growth report includes detailed analyses of the competitive landscape of the market and information about key companies, including:
- Air France KLM SA
- AIT Worldwide Logistics Inc.
- Amazon.com Inc.
- American Global Logistics LLC
- AP Moller Maersk AS
- Blue Dart Express Ltd.
- C H Robinson Worldwide Inc.
- Cargolux Airlines International SA
- CEVA Logistics SA
- Crane Worldwide Logistics
- DACHSER SE
- DB Schenker
- Dimerco Express Corp
- DSV AS
- Expeditors International of Washington Inc.
- FedEx Corp.
- GEODIS
- JD.com Inc.
- PSA International
- United Parcel Service Inc.
- Volga-Dnepr Airlines. LLC
Qualitative and quantitative analysis of companies has been conducted to help clients understand the wider business environment as well as the strengths and weaknesses of key industry players. Data is qualitatively analyzed to categorize companies as pure play, category-focused, industry-focused, and diversified; it is quantitatively analyzed to categorize companies as dominant, leading, strong, tentative, and weak.
Research Analyst Overview
The logistics industry continues to evolve, with air freight services playing a significant role in the global supply chain. Cool-chain systems have become increasingly important for transporting perishable and valuable goods, ensuring their temperature is maintained at specific levels throughout the journey. Technological advancements, such as robotics, automation, artificial intelligence (AI), big data, deep learning, augmented reality, and virtual reality, are revolutionizing air freight operations. These technologies enable more efficient and accurate processing of cargo, reducing the likelihood of errors and improving overall productivity. The air freight industry caters to various sectors, including high-end electronics, automobile components, and pharmaceuticals.
In addition, domestic and international services offer door-to-door and airport-to-airport solutions, making it easier for businesses to transport goods across borders. Online shopping and cross-border e-commerce have also driven demand for faster and more reliable air freight services. Fuel prices and shipping costs are critical factors influencing the industry. Fuel-efficient aircraft and the exploration of alternative fuels are essential for reducing operating costs and minimizing the environmental impact. Route planning and optimization are also crucial for minimizing fuel consumption and improving overall efficiency. The air cargo industry faces several challenges, including refinery capacity constraints and the need for freighter flights to accommodate large volumes of cargo.
Furthermore, freight forwarders play a vital role in managing the logistics providing essential services such as cargo handling, warehousing, and the insurance. High-speed shipments and aircraft operations are essential for meeting the demands of businesses that require quick turnaround times. The Internet of Things (IoT) enables real-time monitoring of cargo, providing greater transparency and improving the overall efficiency of the supply chain. The integration of robotics, automation, AI, big data, and other technologies is enabling more efficient and accurate processing of cargo, while the increasing popularity of online shopping and cross-border e-commerce is driving demand for faster and more reliable services. The industry faces several challenges, including fuel prices, shipping costs, and capacity constraints, but the adoption of fuel-efficient aircraft and alternative fuels, as well as the optimization of routes and the use of real-time monitoring technologies, are helping to address these challenges and ensure the long-term sustainability of the industry.
|
Market Scope |
|
|
Report Coverage |
Details |
|
Page number |
221 |
|
Base year |
2024 |
|
Historic period |
2019-2023 |
|
Forecast period |
2025-2029 |
|
Growth momentum & CAGR |
Accelerate at a CAGR of 4.9% |
|
Market growth 2025-2029 |
USD 64.6 billion |
|
Market structure |
Fragmented |
|
YoY growth 2024-2025(%) |
4.4 |
|
Key countries |
US, China, Japan, India, Canada, UK, South Korea, Germany, France, and Australia |
|
Competitive landscape |
Leading Companies, market growth and forecasting , Market Positioning of Companies, Competitive Strategies, and Industry Risks |
What are the Key Data Covered in this Market Research and Growth Report?
- CAGR of the Air Freight Services industry during the forecast period
- Detailed information on factors that will drive the growth and forecasting between 2025 and 2029
- Precise estimation of the size of the market and its contribution of the industry in focus to the parent market
- Accurate predictions about upcoming growth and trends and changes in consumer behaviour
- Growth of the market across APAC, North America, Europe, Middle East and Africa, and South America
- Thorough analysis of the market's competitive landscape and detailed information about companies
- Comprehensive analysis of factors that will challenge the market growth of industry companies
We can help! Our analysts can customize this market research report to meet your requirements.
 RIA -
RIA - 
