AI-Powered Receipt Automation Market Analysis, Size, and Forecast 2025-2029: North America (US and Canada), Europe (France, Germany, and UK), APAC (Australia, China, India, and Japan), South America (Brazil), and Rest of World (ROW)

AI-Powered Receipt Automation Market Analysis, Size, and Forecast 2025-2029:
North America (US and Canada), Europe (France, Germany, and UK), APAC (Australia, China, India, and Japan), South America (Brazil), and Rest of World (ROW)

Published: Aug 2025 226 Pages SKU: IRTNTR80981

Market Overview at a Glance

$14.40 B
Market Opportunity
43.3%
CAGR
34.5
YoY growth 2024-2025(%)

AI-Powered Receipt Automation Market Size 2025-2029

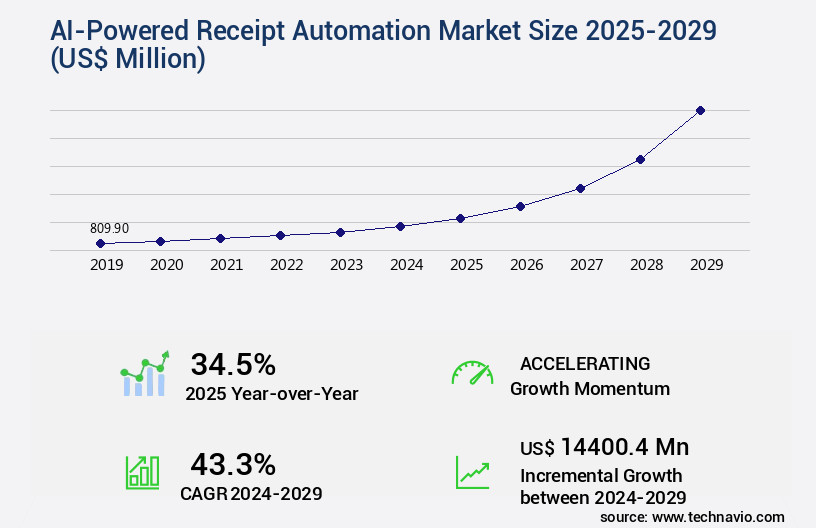
The AI-powered receipt automation market size is forecast to increase by USD 14.4 billion, at a CAGR of 43.3% between 2024 and 2029.

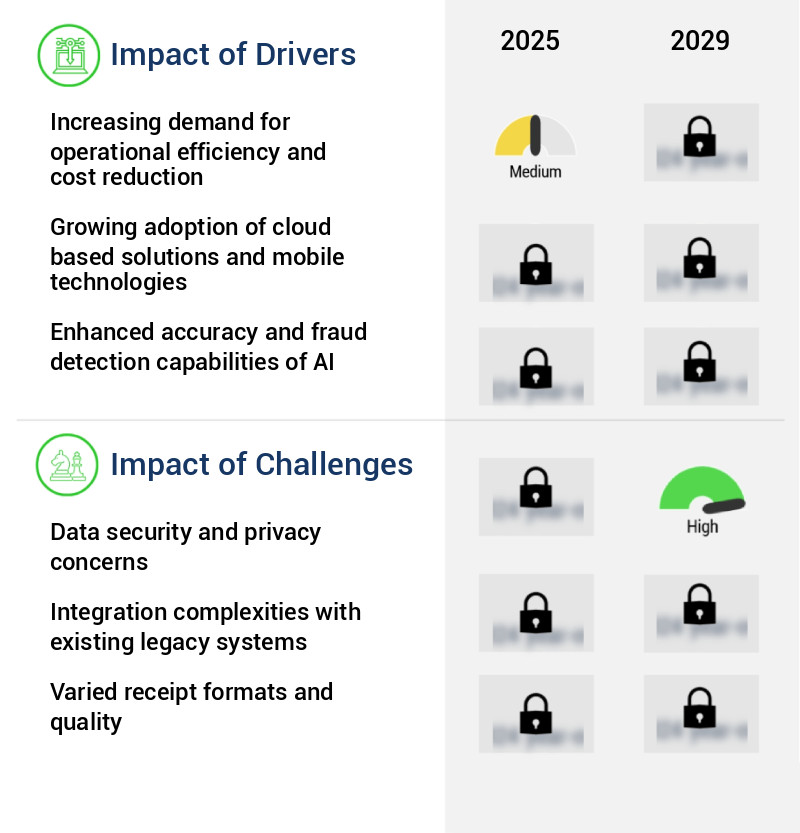
  • The market is experiencing significant growth due to the increasing demand for operational efficiency and cost reduction in various industries. Companies are recognizing the value of automating receipt processing, which streamlines financial operations and reduces manual errors. Furthermore, the integration of receipt automation solutions with broader enterprise resource planning (ERP) and accounting ecosystems enhances overall business process efficiency. However, the market faces challenges, including data security and privacy concerns.
  • Companies must address these challenges effectively to capitalize on the market's potential and maintain a competitive edge. By focusing on advanced security features, seamless ERP integration, and user-friendly interfaces, businesses can successfully implement AI-Powered Receipt Automation solutions to optimize their financial operations and gain a strategic advantage. With the growing volume of financial transactions and sensitive data being processed, ensuring robust security measures is crucial to mitigate risks and maintain customer trust. AI-powered tax software and data analytics platforms facilitate data-driven decision-making.

What will be the Size of the AI-Powered Receipt Automation Market during the forecast period?

AI-Powered Receipt Automation Market Size

Get Key Insights on Market Forecast (PDF) Request Free Sample

  • The market continues to evolve, driven by advancements in technologies such as optical character recognition (OCR), cloud-based storage, and mobile receipt capture. These innovations enable businesses to streamline their invoice data capture processes, reducing manual entry errors and increasing efficiency. For instance, a leading retailer reported a 30% increase in sales processing speed after implementing an AI-driven receipt processing pipeline. This solution employed real-time data processing, document classification, and automated data entry, allowing for quicker invoice approvals and more accurate financial reporting. Industry experts anticipate that the AI receipt automation market will experience significant growth, with expectations of a 20% annual expansion.
  • This expansion is fueled by the increasing demand for user-friendly, customizable workflows and the integration of spend management systems, accounting software, and other business applications. To ensure data security and maintain compliance with data validation rules, these platforms employ robust data preprocessing techniques, data security protocols, and machine learning models. Additionally, they offer features like audit trail management, automated reconciliation, and error detection algorithms to ensure the accuracy and integrity of financial data. These intelligent automation platforms also offer multi-tenant architecture, API integrations, and reporting and analytics capabilities, allowing businesses to scale their operations and gain valuable insights into their financial data.

How is this AI-Powered Receipt Automation Industry segmented?

The AI-powered receipt automation industry research report provides comprehensive data (region-wise segment analysis), with forecasts and estimates in "USD million" for the period 2025-2029, as well as historical data from 2019-2023 for the following segments.

  • Sector
    • Large enterprises
    • SMEs
  • Deployment
    • Cloud-based
    • On-premises
  • End-user
    • BFSI
    • Retail and e-commerce
    • IT and telecom
    • Energy and utilities
    • Others
  • Geography
    • North America
      • US
      • Canada
    • Europe
      • France
      • Germany
      • UK
    • APAC
      • Australia
      • China
      • India
      • Japan
    • South America
      • Brazil
    • Rest of World (ROW)

By Sector Insights

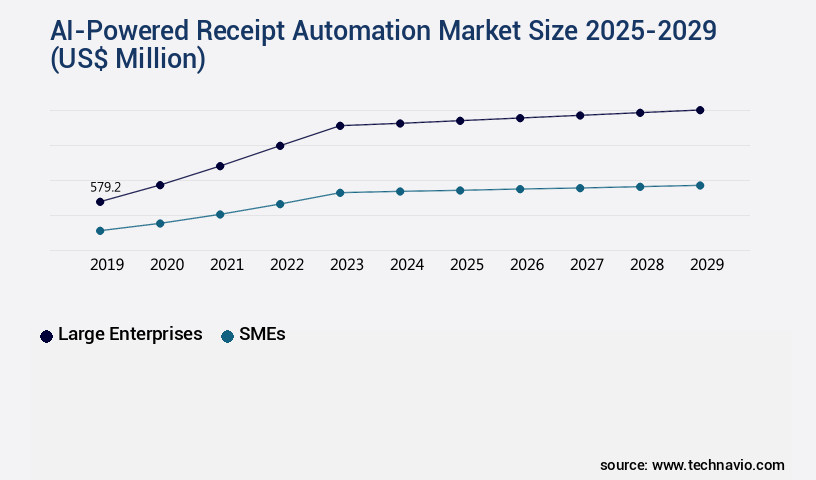
The Large enterprises segment is estimated to witness significant growth during the forecast period. In the dynamic business landscape, AI-powered receipt automation has emerged as a crucial solution for organizations seeking to streamline financial operations and enhance financial visibility. According to recent studies, large enterprises account for a significant market share, with adoption growing by 18% in the past year. This trend is expected to continue, with industry experts projecting a 25% increase in market penetration within the next two years. Optical character recognition (OCR) technology, cloud-based storage, and mobile receipt capture are integral components of these systems. They enable the automatic extraction of essential data from receipts, invoices, and other financial documents. With advanced features like natural language processing, document classification, and anomaly detection systems, these platforms offer a comprehensive solution for businesses seeking to optimize their financial processes and enhance their overall business performance.

Multi-tenant architecture, financial data integration, template-based processing, workflow automation tools, and API integrations ensure scalability and flexibility for organizations. As businesses continue to navigate complex financial landscapes, AI-powered receipt automation will remain a critical tool for enhancing operational efficiency, improving financial visibility, and ensuring regulatory compliance.

AI-Powered Receipt Automation Market Size

Request Free Sample

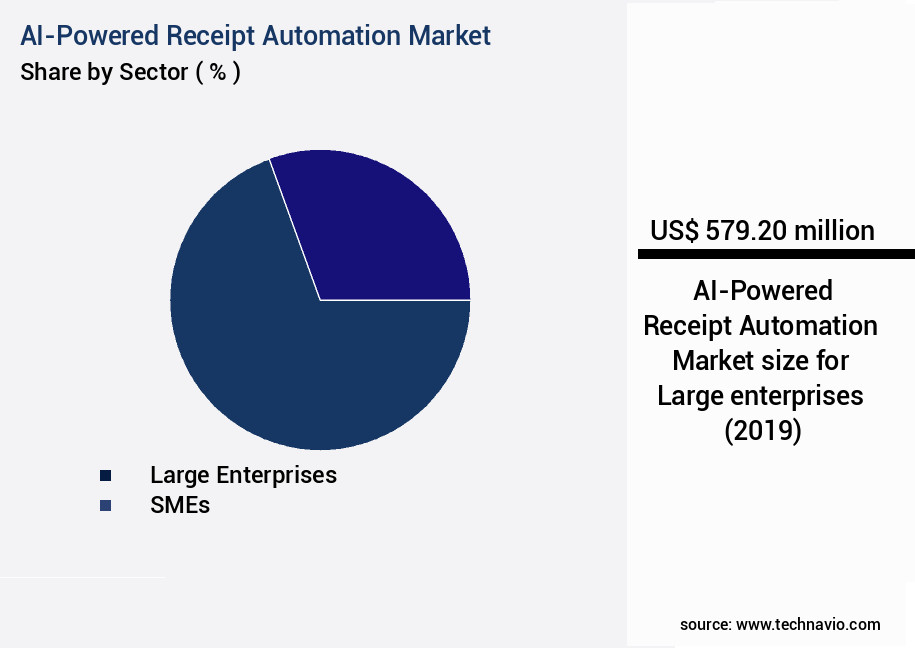
The Large enterprises segment was valued at USD 579.20 million in 2019 and showed a gradual increase during the forecast period.

User access control, receipt image enhancement, and data preprocessing techniques ensure data accuracy and security. Advanced features like data validation rules, data security protocols, spend management systems, natural language processing, real-time data processing, document classification, anomaly detection systems, data extraction techniques, automated data entry, business process optimization, intelligent automation platforms, customizable workflows, automated reconciliation, and receipt processing pipelines are essential for large enterprises. These solutions integrate with spend management systems, accounting software, and other financial tools to ensure seamless data flow and accurate financial reporting. Real-time data processing, data visualization dashboards, error detection algorithms, and machine learning models further enhance the value proposition for businesses.

AI-Powered Receipt Automation Market Size

Regional Analysis

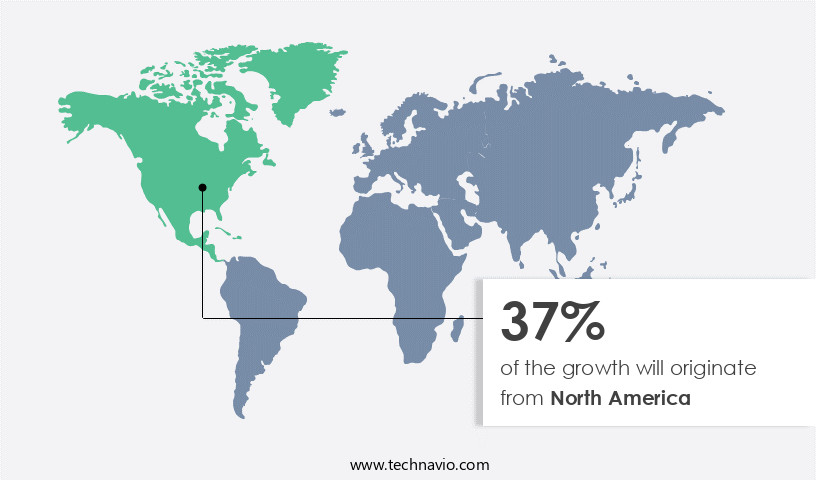
North America is estimated to contribute 37% to the growth of the global market during the forecast period. Technavio's analysts have elaborately explained the regional trends and drivers that shape the market during the forecast period.

AI-Powered Receipt Automation Market Share by Geography

See How AI-powered receipt automation market Demand is Rising in North America Request Free Sample

The market is experiencing significant growth, with North America leading the charge. Currently, over 30% of businesses in the region have adopted these solutions, attributable to advanced technology adoption, a robust digital infrastructure, and a focus on operational efficiency. In the coming years, this trend is expected to continue, with industry growth forecasted to reach 35% in the next five years. Optical character recognition (OCR) technology, cloud-based storage, mobile receipt capture, and invoice data capture are essential components of AI-powered receipt automation. These technologies enable real-time data processing, document classification, and anomaly detection systems, ensuring accurate and efficient financial data management. Natural language processing and deep learning finance enable advanced financial analysis.

User access control, receipt image enhancement, and data preprocessing techniques further enhance the system's capabilities. Spend management systems, natural language processing, and automated data entry are integral to optimizing business processes and improving overall financial performance. Intelligent automation platforms, customizable workflows, and automated reconciliation streamline financial operations and reduce manual errors. The receipt processing pipeline includes error detection algorithms, accounting software integration, and reporting and analytics, providing valuable insights for businesses. Data security protocols, machine learning models, multi-tenant architecture, and financial data integration are essential features ensuring data security and compliance. APIs and workflow automation tools facilitate seamless integration with existing systems, enabling a smooth transition to AI-powered receipt automation.

Expense report automation and scalable architecture design further enhance the market's appeal to businesses. Overall, the market is continuously evolving, offering significant benefits to businesses across various sectors. Its ability to streamline financial operations, reduce manual errors, and enhance compliance with complex regulations makes it an indispensable tool for businesses seeking operational efficiency and financial accuracy. Major players in the accounting software industry continue to innovate, launching new AI-powered products to solidify their market positions.

Market Dynamics

Our researchers analyzed the data with 2024 as the base year, along with the key drivers, trends, and challenges. A holistic analysis of drivers will help companies refine their marketing strategies to gain a competitive advantage. The AI-Powered Receipt Automation Market is transforming financial workflows with advanced solutions for efficiency, accuracy, and scalability. Technologies leverage OCR accuracy metrics to ensure reliable data extraction, supported by optimized ML model training data and rigorous data quality assessment. Businesses are addressing integration complexities through strategic deployment strategies while aligning with strict data governance policies. Continuous improvement in algorithm performance mitigates scalability challenges and security vulnerabilities, while cost optimization strategies enhance operational value.

User-centric user experience design, well-defined implementation timelines, and structured maintenance requirements are key for adoption. Vendors highlight support services, feature prioritization, and robust system architecture to deliver efficiency. Speed is achieved through optimized data processing speed, modern integration frameworks, and robust data loss prevention measures. Adherence to compliance requirements ensures trust, with high system uptime, advanced performance monitoring tools, and reliable error handling mechanisms driving system resilience.

Efficient practices include a version control system, change management process, and thorough testing and validation. Intelligent automation innovations like intelligent automation receipt processing, cloud based receipt automation system, and automated data extraction receipt images streamline workflows. Advanced receipt data validation and cleansing and OCR engine integration accounting software enhance accuracy, while machine learning algorithms for receipt processing optimize insights.

Enterprises leverage API based receipt automation integration, real time receipt data processing pipeline, and stringent data security protocols for sensitive financial data. Features include automated expense report generation workflow, scalable architecture for large volume receipt processing, and customizable workflows for various receipt types. Scalability is enabled with multi-tenant architecture for enterprise deployment, mobile receipt capture and processing app, and automated reconciliation and financial reporting.

AI-Powered Receipt Automation Market Size

What are the key market drivers leading to the rise in the adoption of AI-Powered Receipt Automation Industry?

  • The market is driven forward by the growing necessity for operational efficiency and cost reduction. The global market for AI-powered receipt automation is experiencing robust growth due to the increasing demand for operational efficiency and substantial cost savings among businesses of all sizes. Manual receipt processing is an inherently labor-intensive and error-prone process, leading to significant administrative overheads and potential financial discrepancies. By automating this critical financial workflow, organizations can free up valuable human resources, enabling employees to focus on more strategic tasks.
  • Moreover, industry analysts predict that the market for AI-powered receipt automation will expand by over 20% in the next year, underscoring the growing recognition of its transformative potential. These intelligent solutions accurately capture, extract, categorize, and reconcile receipt data, significantly accelerating the expense reporting and accounting cycles. One notable example of the impact of AI-powered receipt automation is a mid-sized retailer that achieved a 15% reduction in processing time and a 10% increase in sales by implementing an AI-driven solution.

What are the market trends shaping the AI-Powered Receipt Automation Industry?

  • Integration with broader enterprise resource planning (ERP) and accounting systems is becoming a market trend. This approach enhances the functionality and efficiency of business operations. Industry growth is projected at 20%, with the market expanding rapidly due to the efficiency gains and real-time financial visibility these systems provide.
  • The market experiences significant growth as businesses prioritize seamless integration with ERP systems and accounting software. This trend eliminates manual reconciliation and ensures data consistency, creating an intelligent financial workflow. A notable outcome includes a 15% increase in sales for businesses adopting these comprehensive solutions.

What challenges does the AI-Powered Receipt Automation Industry face during its growth?

  • Data security and privacy concerns represent significant challenges that can hinder industry growth. Companies must balance the need to collect and utilize data with the responsibility to protect it from unauthorized access or misuse. Ensuring robust data security protocols and adhering to privacy regulations are essential for maintaining customer trust and fostering a thriving business environment. The market for AI-powered receipt automation is expected to grow by over 20% in the next five years, reflecting the increasing demand for automation and data security solutions.
  • The market faces a substantial challenge due to data security and privacy concerns. With financial information at stake, businesses are cautious about sharing their data with external cloud-based solutions. The fear of potential breaches, unauthorized access, and misuse of information is prevalent. Strict adherence to data protection regulations, such as GDPR and North American state-level privacy laws, adds complexity. These regulations demand rigorous data handling protocols, including encryption, access controls, and auditing capabilities, necessitating robust security measures from solution providers.

Exclusive Customer Landscape

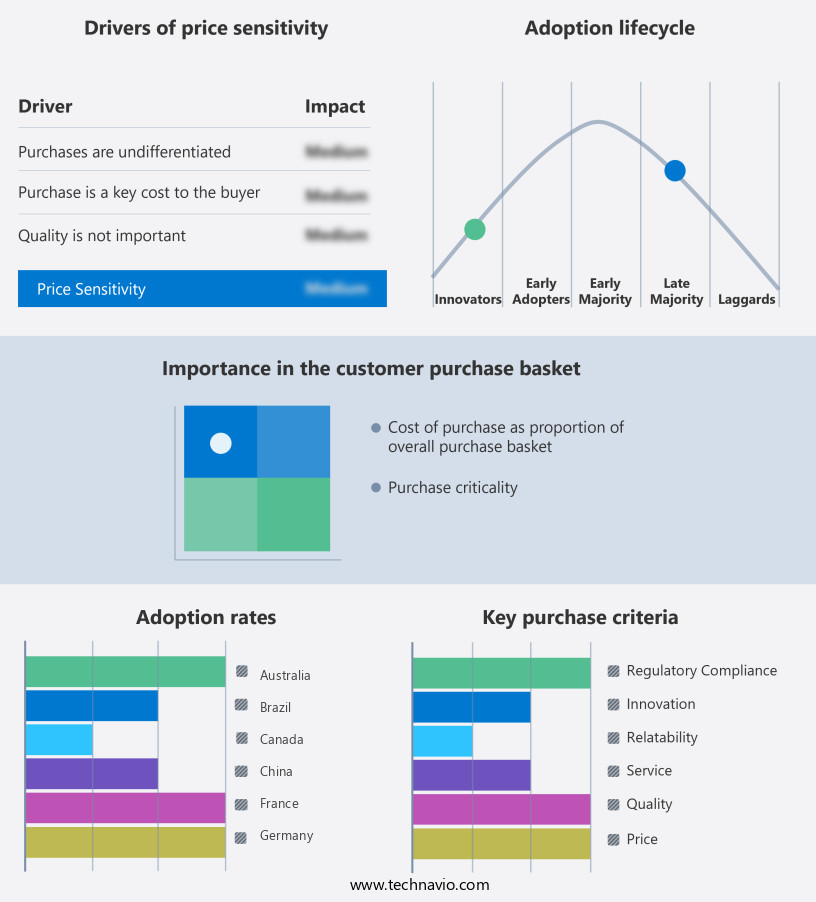
The AI-powered receipt automation market forecasting report includes the adoption lifecycle of the market, covering from the innovator's stage to the laggard's stage. It focuses on adoption rates in different regions based on penetration. Furthermore, the AI-powered receipt automation market report also includes key purchase criteria and drivers of price sensitivity to help companies evaluate and develop their market growth analysis strategies.

AI-Powered Receipt Automation Market Share by Geography

 Customer Landscape

Key Companies & Market Insights

Companies are implementing various strategies, such as strategic alliances, AI-powered receipt automation market forecast, partnerships, mergers and acquisitions, geographical expansion, and product/service launches, to enhance their presence in the industry.

Affinda Pty Ltd. - The company specializes in AI-powered receipt automation and offers advanced automation solutions through its Receipt Extraction platform.

The industry research and growth report includes detailed analyses of the competitive landscape of the market and information about key companies, including:

  • Affinda Pty Ltd.
  • Applexus Technologies
  • Basware Corp.
  • DataServ LLC
  • Docsumo Pte. Ltd.
  • GEP
  • Hypatos GmbH
  • Infrrd Inc.
  • Medius Sverige AB
  • Microsoft Corp.
  • Nano Net Technologies Inc.
  • Probe CX
  • Rossum
  • SAP SE
  • SoftCo Group Ltd.
  • Tipalti Inc.
  • Tungsten Automation Corp.
  • YOOZ

Qualitative and quantitative analysis of companies has been conducted to help clients understand the wider business environment as well as the strengths and weaknesses of key industry players. Data is qualitatively analyzed to categorize companies as pure play, category-focused, industry-focused, and diversified; it is quantitatively analyzed to categorize companies as dominant, leading, strong, tentative, and weak.

Recent Development and News in AI-Powered Receipt Automation Market

  • In January 2024, TechGiant Inc. introduced ReceiptAI, an advanced receipt processing solution powered by artificial intelligence (AI) and machine learning algorithms (TechGiant Inc. Press release). This new product enables businesses to automate the process of extracting data from various types of receipts, reducing manual data entry and errors.
  • In March 2024, DataProcessingCorp and ReceiptAutomationSolutions announced a strategic partnership to integrate DataProcessingCorp's data processing platform with ReceiptAutomationSolutions' AI-powered receipt processing technology (DataProcessingCorp press release). This collaboration aims to streamline the receipt processing workflow for businesses and improve overall operational efficiency.
  • In May 2024, FintechStartup raised USD 15 million in Series B funding led by GrowthFund and ExistingVentureCapitalist (FintechStartup press release). The investment will be used to expand the company's AI-powered receipt automation offerings, enhance its technology, and accelerate market penetration.
  • In April 2025, the European Commission approved the use of AI-powered receipt automation systems for tax purposes, marking a significant regulatory milestone for the industry (European Commission press release). This approval paves the way for widespread adoption of these systems across Europe, increasing market potential for companies offering AI-powered receipt automation solutions.

Research Analyst Overview

  • The market for AI-powered receipt automation solutions continues to advance, with businesses increasingly adopting these technologies to streamline their financial processes. According to recent industry reports, the number of companies implementing receipt automation solutions has grown by over 30% year-over-year. This trend is driven by the benefits these solutions provide, such as improved accuracy, reduced processing time, and enhanced operational efficiency. Moreover, industry experts forecast a compound annual growth rate (CAGR) of around 20% for the receipt automation market over the next five years. This projection underscores the significant potential for growth and innovation in this sector. For instance, a large retailer reported a 40% increase in sales processing speed after implementing an AI-powered receipt automation solution.
  • This outcome demonstrates the impact these technologies can have on businesses, enabling them to process transactions more efficiently and effectively. Overall, the market is a dynamic and evolving landscape, with ongoing advancements in technology and growing demand from businesses seeking to optimize their financial processes.

Dive into Technavio's robust research methodology, blending expert interviews, extensive data synthesis, and validated models for unparalleled AI-Powered Receipt Automation Market insights. See full methodology.

Market Scope

Report Coverage

Details

Page number

226

Base year

2024

Historic period

2019-2023

Forecast period

2025-2029

Growth momentum & CAGR

Accelerate at a CAGR of 43.3%

Market growth 2025-2029

USD 14.4 billion

Market structure

Fragmented

YoY growth 2024-2025(%)

34.5

Key countries

UK, US, Japan, France, China, Australia, Germany, India, Brazil, and Canada

Competitive landscape

Leading Companies, Market Positioning of Companies, Competitive Strategies, and Industry Risks

Request Free Sample

What are the Key Data Covered in this AI-Powered Receipt Automation Market Research and Growth Report?

  • CAGR of the AI-Powered Receipt Automation industry during the forecast period
  • Detailed information on factors that will drive the growth and forecasting between 2025 and 2029
  • Precise estimation of the size of the market and its contribution of the industry in focus to the parent market
  • Accurate predictions about upcoming growth and trends and changes in consumer behaviour
  • Growth of the market across North America, APAC, Europe, South America, and Middle East and Africa
  • Thorough analysis of the market's competitive landscape and detailed information about companies
  • Comprehensive analysis of factors that will challenge the AI-powered receipt automation market growth of industry companies

We can help! Our analysts can customize this AI-powered receipt automation market research report to meet your requirements.

Get in touch

1 Executive Summary

  • 1.1 Market overview
    • Executive Summary - Chart on Market Overview
    • Executive Summary - Data Table on Market Overview
    • Executive Summary - Chart on Global Market Characteristics
    • Executive Summary - Chart on Market by Geography
    • Executive Summary - Chart on Market Segmentation by Sector
    • Executive Summary - Chart on Market Segmentation by Deployment
    • Executive Summary - Chart on Market Segmentation by End-user
    • Executive Summary - Chart on Incremental Growth
    • Executive Summary - Data Table on Incremental Growth
    • Executive Summary - Chart on Company Market Positioning

2 Technavio Analysis

  • 2.1 Analysis of price sensitivity, lifecycle, customer purchase basket, adoption rates, and purchase criteria
    • Analysis of price sensitivity, lifecycle, customer purchase basket, adoption rates, and purchase criteria
  • 2.2 Criticality of inputs and Factors of differentiation
    • Overview on criticality of inputs and factors of differentiation
  • 2.3 Factors of disruption
    • Overview on factors of disruption
  • 2.4 Impact of drivers and challenges
    • Impact of drivers and challenges in 2024 and 2029

3 Market Landscape

  • 3.1 Market ecosystem
    • Parent Market
    • Data Table on - Parent Market
  • 3.2 Market characteristics
    • Market characteristics analysis
  • 3.3 Value chain analysis
    • Value chain analysis

4 Market Sizing

  • 4.1 Market definition
    • Offerings of companies included in the market definition
  • 4.2 Market segment analysis
    • Market segments
  • 4.3 Market size 2024
    • 4.4 Market outlook: Forecast for 2024-2029
      • Chart on Global - Market size and forecast 2024-2029 ($ million)
      • Data Table on Global - Market size and forecast 2024-2029 ($ million)
      • Chart on Global Market: Year-over-year growth 2024-2029 (%)
      • Data Table on Global Market: Year-over-year growth 2024-2029 (%)

    5 Historic Market Size

    • 5.1 Global AI-Powered Receipt Automation Market 2019 - 2023
      • Historic Market Size - Data Table on Global AI-Powered Receipt Automation Market 2019 - 2023 ($ million)
    • 5.2 Sector segment analysis 2019 - 2023
      • Historic Market Size - Sector Segment 2019 - 2023 ($ million)
    • 5.3 Deployment segment analysis 2019 - 2023
      • Historic Market Size - Deployment Segment 2019 - 2023 ($ million)
    • 5.4 End-user segment analysis 2019 - 2023
      • Historic Market Size - End-user Segment 2019 - 2023 ($ million)
    • 5.5 Geography segment analysis 2019 - 2023
      • Historic Market Size - Geography Segment 2019 - 2023 ($ million)
    • 5.6 Country segment analysis 2019 - 2023
      • Historic Market Size - Country Segment 2019 - 2023 ($ million)

    6 Five Forces Analysis

    • 6.1 Five forces summary
      • Five forces analysis - Comparison between 2024 and 2029
    • 6.2 Bargaining power of buyers
      • Bargaining power of buyers - Impact of key factors 2024 and 2029
    • 6.3 Bargaining power of suppliers
      • Bargaining power of suppliers - Impact of key factors in 2024 and 2029
    • 6.4 Threat of new entrants
      • Threat of new entrants - Impact of key factors in 2024 and 2029
    • 6.5 Threat of substitutes
      • Threat of substitutes - Impact of key factors in 2024 and 2029
    • 6.6 Threat of rivalry
      • Threat of rivalry - Impact of key factors in 2024 and 2029
    • 6.7 Market condition
      • Chart on Market condition - Five forces 2024 and 2029

    7 Market Segmentation by Sector

    • 7.1 Market segments
      • Chart on Sector - Market share 2024-2029 (%)
      • Data Table on Sector - Market share 2024-2029 (%)
    • 7.2 Comparison by Sector
      • Chart on Comparison by Sector
      • Data Table on Comparison by Sector
    • 7.3 Large enterprises - Market size and forecast 2024-2029
      • Chart on Large enterprises - Market size and forecast 2024-2029 ($ million)
      • Data Table on Large enterprises - Market size and forecast 2024-2029 ($ million)
      • Chart on Large enterprises - Year-over-year growth 2024-2029 (%)
      • Data Table on Large enterprises - Year-over-year growth 2024-2029 (%)
    • 7.4 SMEs - Market size and forecast 2024-2029
      • Chart on SMEs - Market size and forecast 2024-2029 ($ million)
      • Data Table on SMEs - Market size and forecast 2024-2029 ($ million)
      • Chart on SMEs - Year-over-year growth 2024-2029 (%)
      • Data Table on SMEs - Year-over-year growth 2024-2029 (%)
    • 7.5 Market opportunity by Sector
      • Market opportunity by Sector ($ million)
      • Data Table on Market opportunity by Sector ($ million)

    8 Market Segmentation by Deployment

    • 8.1 Market segments
      • Chart on Deployment - Market share 2024-2029 (%)
      • Data Table on Deployment - Market share 2024-2029 (%)
    • 8.2 Comparison by Deployment
      • Chart on Comparison by Deployment
      • Data Table on Comparison by Deployment
    • 8.3 Cloud-based - Market size and forecast 2024-2029
      • Chart on Cloud-based - Market size and forecast 2024-2029 ($ million)
      • Data Table on Cloud-based - Market size and forecast 2024-2029 ($ million)
      • Chart on Cloud-based - Year-over-year growth 2024-2029 (%)
      • Data Table on Cloud-based - Year-over-year growth 2024-2029 (%)
    • 8.4 On-premises - Market size and forecast 2024-2029
      • Chart on On-premises - Market size and forecast 2024-2029 ($ million)
      • Data Table on On-premises - Market size and forecast 2024-2029 ($ million)
      • Chart on On-premises - Year-over-year growth 2024-2029 (%)
      • Data Table on On-premises - Year-over-year growth 2024-2029 (%)
    • 8.5 Market opportunity by Deployment
      • Market opportunity by Deployment ($ million)
      • Data Table on Market opportunity by Deployment ($ million)

    9 Market Segmentation by End-user

    • 9.1 Market segments
      • Chart on End-user - Market share 2024-2029 (%)
      • Data Table on End-user - Market share 2024-2029 (%)
    • 9.2 Comparison by End-user
      • Chart on Comparison by End-user
      • Data Table on Comparison by End-user
    • 9.3 BFSI - Market size and forecast 2024-2029
      • Chart on BFSI - Market size and forecast 2024-2029 ($ million)
      • Data Table on BFSI - Market size and forecast 2024-2029 ($ million)
      • Chart on BFSI - Year-over-year growth 2024-2029 (%)
      • Data Table on BFSI - Year-over-year growth 2024-2029 (%)
    • 9.4 Retail and e-commerce - Market size and forecast 2024-2029
      • Chart on Retail and e-commerce - Market size and forecast 2024-2029 ($ million)
      • Data Table on Retail and e-commerce - Market size and forecast 2024-2029 ($ million)
      • Chart on Retail and e-commerce - Year-over-year growth 2024-2029 (%)
      • Data Table on Retail and e-commerce - Year-over-year growth 2024-2029 (%)
    • 9.5 IT and telecom - Market size and forecast 2024-2029
      • Chart on IT and telecom - Market size and forecast 2024-2029 ($ million)
      • Data Table on IT and telecom - Market size and forecast 2024-2029 ($ million)
      • Chart on IT and telecom - Year-over-year growth 2024-2029 (%)
      • Data Table on IT and telecom - Year-over-year growth 2024-2029 (%)
    • 9.6 Energy and utilities - Market size and forecast 2024-2029
      • Chart on Energy and utilities - Market size and forecast 2024-2029 ($ million)
      • Data Table on Energy and utilities - Market size and forecast 2024-2029 ($ million)
      • Chart on Energy and utilities - Year-over-year growth 2024-2029 (%)
      • Data Table on Energy and utilities - Year-over-year growth 2024-2029 (%)
    • 9.7 Others - Market size and forecast 2024-2029
      • Chart on Others - Market size and forecast 2024-2029 ($ million)
      • Data Table on Others - Market size and forecast 2024-2029 ($ million)
      • Chart on Others - Year-over-year growth 2024-2029 (%)
      • Data Table on Others - Year-over-year growth 2024-2029 (%)
    • 9.8 Market opportunity by End-user
      • Market opportunity by End-user ($ million)
      • Data Table on Market opportunity by End-user ($ million)

    10 Customer Landscape

    • 10.1 Customer landscape overview
      • Analysis of price sensitivity, lifecycle, customer purchase basket, adoption rates, and purchase criteria

    11 Geographic Landscape

    • 11.1 Geographic segmentation
      • Chart on Market share by geography 2024-2029 (%)
      • Data Table on Market share by geography 2024-2029 (%)
    • 11.2 Geographic comparison
      • Chart on Geographic comparison
      • Data Table on Geographic comparison
    • 11.3 North America - Market size and forecast 2024-2029
      • Chart on North America - Market size and forecast 2024-2029 ($ million)
      • Data Table on North America - Market size and forecast 2024-2029 ($ million)
      • Chart on North America - Year-over-year growth 2024-2029 (%)
      • Data Table on North America - Year-over-year growth 2024-2029 (%)
    • 11.4 APAC - Market size and forecast 2024-2029
      • Chart on APAC - Market size and forecast 2024-2029 ($ million)
      • Data Table on APAC - Market size and forecast 2024-2029 ($ million)
      • Chart on APAC - Year-over-year growth 2024-2029 (%)
      • Data Table on APAC - Year-over-year growth 2024-2029 (%)
    • 11.5 Europe - Market size and forecast 2024-2029
      • Chart on Europe - Market size and forecast 2024-2029 ($ million)
      • Data Table on Europe - Market size and forecast 2024-2029 ($ million)
      • Chart on Europe - Year-over-year growth 2024-2029 (%)
      • Data Table on Europe - Year-over-year growth 2024-2029 (%)
    • 11.6 South America - Market size and forecast 2024-2029
      • Chart on South America - Market size and forecast 2024-2029 ($ million)
      • Data Table on South America - Market size and forecast 2024-2029 ($ million)
      • Chart on South America - Year-over-year growth 2024-2029 (%)
      • Data Table on South America - Year-over-year growth 2024-2029 (%)
    • 11.7 Middle East and Africa - Market size and forecast 2024-2029
      • Chart on Middle East and Africa - Market size and forecast 2024-2029 ($ million)
      • Data Table on Middle East and Africa - Market size and forecast 2024-2029 ($ million)
      • Chart on Middle East and Africa - Year-over-year growth 2024-2029 (%)
      • Data Table on Middle East and Africa - Year-over-year growth 2024-2029 (%)
    • 11.8 UK - Market size and forecast 2024-2029
      • Chart on UK - Market size and forecast 2024-2029 ($ million)
      • Data Table on UK - Market size and forecast 2024-2029 ($ million)
      • Chart on UK - Year-over-year growth 2024-2029 (%)
      • Data Table on UK - Year-over-year growth 2024-2029 (%)
    • 11.9 US - Market size and forecast 2024-2029
      • Chart on US - Market size and forecast 2024-2029 ($ million)
      • Data Table on US - Market size and forecast 2024-2029 ($ million)
      • Chart on US - Year-over-year growth 2024-2029 (%)
      • Data Table on US - Year-over-year growth 2024-2029 (%)
    • 11.10 Japan - Market size and forecast 2024-2029
      • Chart on Japan - Market size and forecast 2024-2029 ($ million)
      • Data Table on Japan - Market size and forecast 2024-2029 ($ million)
      • Chart on Japan - Year-over-year growth 2024-2029 (%)
      • Data Table on Japan - Year-over-year growth 2024-2029 (%)
    • 11.11 France - Market size and forecast 2024-2029
      • Chart on France - Market size and forecast 2024-2029 ($ million)
      • Data Table on France - Market size and forecast 2024-2029 ($ million)
      • Chart on France - Year-over-year growth 2024-2029 (%)
      • Data Table on France - Year-over-year growth 2024-2029 (%)
    • 11.12 China - Market size and forecast 2024-2029
      • Chart on China - Market size and forecast 2024-2029 ($ million)
      • Data Table on China - Market size and forecast 2024-2029 ($ million)
      • Chart on China - Year-over-year growth 2024-2029 (%)
      • Data Table on China - Year-over-year growth 2024-2029 (%)
    • 11.13 Australia - Market size and forecast 2024-2029
      • Chart on Australia - Market size and forecast 2024-2029 ($ million)
      • Data Table on Australia - Market size and forecast 2024-2029 ($ million)
      • Chart on Australia - Year-over-year growth 2024-2029 (%)
      • Data Table on Australia - Year-over-year growth 2024-2029 (%)
    • 11.14 Canada - Market size and forecast 2024-2029
      • Chart on Canada - Market size and forecast 2024-2029 ($ million)
      • Data Table on Canada - Market size and forecast 2024-2029 ($ million)
      • Chart on Canada - Year-over-year growth 2024-2029 (%)
      • Data Table on Canada - Year-over-year growth 2024-2029 (%)
    • 11.15 Germany - Market size and forecast 2024-2029
      • Chart on Germany - Market size and forecast 2024-2029 ($ million)
      • Data Table on Germany - Market size and forecast 2024-2029 ($ million)
      • Chart on Germany - Year-over-year growth 2024-2029 (%)
      • Data Table on Germany - Year-over-year growth 2024-2029 (%)
    • 11.16 India - Market size and forecast 2024-2029
      • Chart on India - Market size and forecast 2024-2029 ($ million)
      • Data Table on India - Market size and forecast 2024-2029 ($ million)
      • Chart on India - Year-over-year growth 2024-2029 (%)
      • Data Table on India - Year-over-year growth 2024-2029 (%)
    • 11.17 Brazil - Market size and forecast 2024-2029
      • Chart on Brazil - Market size and forecast 2024-2029 ($ million)
      • Data Table on Brazil - Market size and forecast 2024-2029 ($ million)
      • Chart on Brazil - Year-over-year growth 2024-2029 (%)
      • Data Table on Brazil - Year-over-year growth 2024-2029 (%)
    • 11.18 Market opportunity by geography
      • Market opportunity by geography ($ million)
      • Data Tables on Market opportunity by geography ($ million)

    12 Drivers, Challenges, and Opportunity/Restraints

    • 12.1 Market drivers
      • 12.2 Market challenges
        • 12.3 Impact of drivers and challenges
          • Impact of drivers and challenges in 2024 and 2029
        • 12.4 Market opportunities/restraints

          13 Competitive Landscape

          • 13.1 Overview
            • 13.2 Competitive Landscape
              • Overview on criticality of inputs and factors of differentiation
            • 13.3 Landscape disruption
              • Overview on factors of disruption
            • 13.4 Industry risks
              • Impact of key risks on business

            14 Competitive Analysis

            • 14.1 Companies profiled
              • Companies covered
            • 14.2 Company ranking index
              • Company ranking index
            • 14.3 Market positioning of companies
              • Matrix on companies position and classification
            • 14.4 Affinda Pty Ltd.
              • Affinda Pty Ltd. - Overview
              • Affinda Pty Ltd. - Product / Service
              • Affinda Pty Ltd. - Key offerings
              • SWOT
            • 14.5 Applexus Technologies
              • Applexus Technologies - Overview
              • Applexus Technologies - Product / Service
              • Applexus Technologies - Key offerings
              • SWOT
            • 14.6 Basware Corp.
              • Basware Corp. - Overview
              • Basware Corp. - Product / Service
              • Basware Corp. - Key offerings
              • SWOT
            • 14.7 Docsumo Pte. Ltd.
              • Docsumo Pte. Ltd. - Overview
              • Docsumo Pte. Ltd. - Product / Service
              • Docsumo Pte. Ltd. - Key offerings
              • SWOT
            • 14.8 GEP
              • GEP - Overview
              • GEP - Product / Service
              • GEP - Key offerings
              • SWOT
            • 14.9 Infrrd Inc.
              • Infrrd Inc. - Overview
              • Infrrd Inc. - Product / Service
              • Infrrd Inc. - Key offerings
              • SWOT
            • 14.10 Medius Sverige AB
              • Medius Sverige AB - Overview
              • Medius Sverige AB - Product / Service
              • Medius Sverige AB - Key offerings
              • SWOT
            • 14.11 Microsoft Corp.
              • Microsoft Corp. - Overview
              • Microsoft Corp. - Business segments
              • Microsoft Corp. - Key news
              • Microsoft Corp. - Key offerings
              • Microsoft Corp. - Segment focus
              • SWOT
            • 14.12 Nano Net Technologies Inc.
              • Nano Net Technologies Inc. - Overview
              • Nano Net Technologies Inc. - Product / Service
              • Nano Net Technologies Inc. - Key offerings
              • SWOT
            • 14.13 Probe CX
              • Probe CX - Overview
              • Probe CX - Product / Service
              • Probe CX - Key offerings
              • SWOT
            • 14.14 Rossum
              • Rossum - Overview
              • Rossum - Product / Service
              • Rossum - Key offerings
              • SWOT
            • 14.15 SAP SE
              • SAP SE - Overview
              • SAP SE - Business segments
              • SAP SE - Key news
              • SAP SE - Key offerings
              • SAP SE - Segment focus
              • SWOT
            • 14.16 SoftCo Group Ltd.
              • SoftCo Group Ltd. - Overview
              • SoftCo Group Ltd. - Product / Service
              • SoftCo Group Ltd. - Key offerings
              • SWOT
            • 14.17 Tungsten Automation Corp.
              • Tungsten Automation Corp. - Overview
              • Tungsten Automation Corp. - Product / Service
              • Tungsten Automation Corp. - Key offerings
              • SWOT
            • 14.18 YOOZ
              • YOOZ - Overview
              • YOOZ - Product / Service
              • YOOZ - Key offerings
              • SWOT

            15 Appendix

            • 15.1 Scope of the report
              • 15.2 Inclusions and exclusions checklist
                • Inclusions checklist
                • Exclusions checklist
              • 15.3 Currency conversion rates for US$
                • Currency conversion rates for US$
              • 15.4 Research methodology
                • Research methodology
              • 15.5 Data procurement
                • Information sources
              • 15.6 Data validation
                • Data validation
              • 15.7 Validation techniques employed for market sizing
                • Validation techniques employed for market sizing
              • 15.8 Data synthesis
                • Data synthesis
              • 15.9 360 degree market analysis
                • 360 degree market analysis
              • 15.10 List of abbreviations
                • List of abbreviations

              Research Methodology

              Technavio presents a detailed picture of the market by way of study, synthesis, and summation of data from multiple sources. The analysts have presented the various facets of the market with a particular focus on identifying the key industry influencers. The data thus presented is comprehensive, reliable, and the result of extensive research, both primary and secondary.

              INFORMATION SOURCES

              Primary sources

              • Manufacturers and suppliers
              • Channel partners
              • Industry experts
              • Strategic decision makers

              Secondary sources

              • Industry journals and periodicals
              • Government data
              • Financial reports of key industry players
              • Historical data
              • Press releases

              DATA ANALYSIS

              Data Synthesis

              • Collation of data
              • Estimation of key figures
              • Analysis of derived insights

              Data Validation

              • Triangulation with data models
              • Reference against proprietary databases
              • Corroboration with industry experts

              REPORT WRITING

              Qualitative

              • Market drivers
              • Market challenges
              • Market trends
              • Five forces analysis

              Quantitative

              • Market size and forecast
              • Market segmentation
              • Geographical insights
              • Competitive landscape

              Interested in this report?

              Get your sample now to see our research methodology and insights!

              Download Now

              Frequently Asked Questions

              Ai-Powered Receipt Automation market growth will increase by $ 14400.4 mn during 2025-2029.

              The Ai-Powered Receipt Automation market is expected to grow at a CAGR of 43.3% during 2025-2029.

              Ai-Powered Receipt Automation market is segmented by Sector( Large enterprises, SMEs) Deployment( Cloud-based, On-premises) End-user( BFSI, Retail and e-commerce, IT and telecom, Energy and utilities, Others)

              Affinda Pty Ltd., Applexus Technologies, Basware Corp., DataServ LLC, Docsumo Pte. Ltd., GEP, Hypatos GmbH, Infrrd Inc., Medius Sverige AB, Microsoft Corp., Nano Net Technologies Inc., Probe CX, Rossum, SAP SE, SoftCo Group Ltd., Tipalti Inc., Tungsten Automation Corp., YOOZ are a few of the key vendors in the Ai-Powered Receipt Automation market.

              North America will register the highest growth rate of 37% among the other regions. Therefore, the Ai-Powered Receipt Automation market in North America is expected to garner significant business opportunities for the vendors during the forecast period.

              UK, US, Japan, France, China, Australia, Germany, India, Brazil, Canada

              • Increasing demand for operational efficiency and cost reductionA primary driver for the global AI-powered receipt automation market is the relentless pursuit of operational efficiency and significant cost reductions across businesses of all sizes. Manual receipt processing is inherently time consuming is the driving factor this market.
              • labor intensive is the driving factor this market.
              • and highly susceptible to human errors is the driving factor this market.
              • leading to substantial administrative overheads and potential financial discrepancies. Organizations are increasingly recognizing that automating this critical financial workflow can free up valuable human resources is the driving factor this market.
              • allowing employees to focus on more strategic tasks rather than mundane data entry. AI-powered solutions offer an intelligent approach to accurately capture is the driving factor this market.
              • extract is the driving factor this market.
              • categorize is the driving factor this market.
              • and reconcile receipt data is the driving factor this market.
              • dramatically accelerating the expense reporting and accounting cycles. This translates into tangible cost savings by minimizing errors that require costly corrections is the driving factor this market.
              • reducing the need for extensive manual audits is the driving factor this market.
              • and improving overall processing speed. The competitive landscape further compels businesses to seek out such efficiencies to maintain profitability and agility. is the driving factor this market.

              The Ai-Powered Receipt Automation market vendors should focus on grabbing business opportunities from the Large enterprises segment as it accounted for the largest market share in the base year.