AI Pet Health Wearables Market Analysis, Size, and Forecast 2026-2030: North America (US, Canada, and Mexico), Europe (Germany, UK, and France), APAC (China, Japan, and India), South America (Brazil, Argentina, and Colombia), Middle East and Africa (Israel, South Africa, and Saudi Arabia), and Rest of World (ROW)

AI Pet Health Wearables Market Analysis, Size, and Forecast 2026-2030:
North America (US, Canada, and Mexico), Europe (Germany, UK, and France), APAC (China, Japan, and India), South America (Brazil, Argentina, and Colombia), Middle East and Africa (Israel, South Africa, and Saudi Arabia), and Rest of World (ROW)

Published: Mar 2026 278 Pages SKU: IRTNTR81371

Market Overview at a Glance

$513.46 Mn
Market Opportunity
18.1%
CAGR 2025 - 2030
40.9%
North America Growth
$188.78 Mn
Smart collars segment 2024

AI Pet Health Wearables Market Size 2026-2030

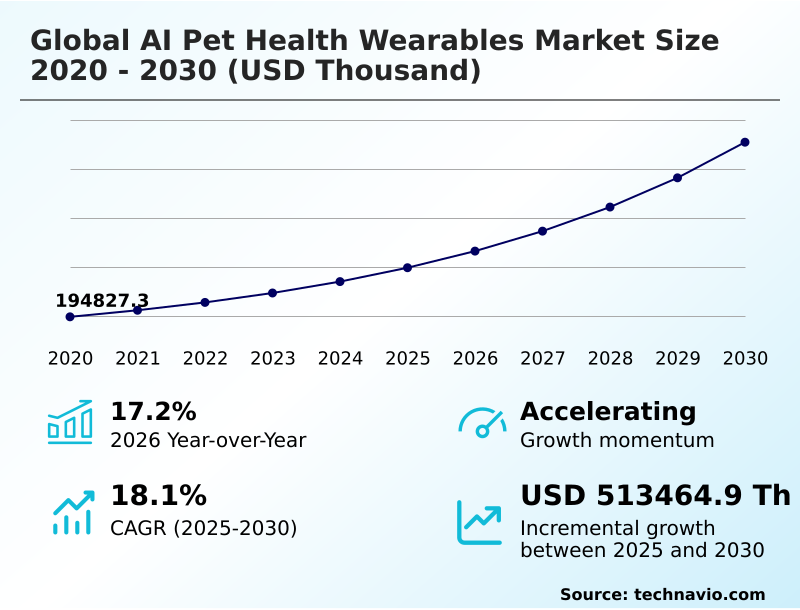
The ai pet health wearables market size is valued to increase by USD 513.46 million, at a CAGR of 18.1% from 2025 to 2030. Escalating humanization of companion animals and surge in veterinary expenditure will drive the ai pet health wearables market.

Major Market Trends & Insights

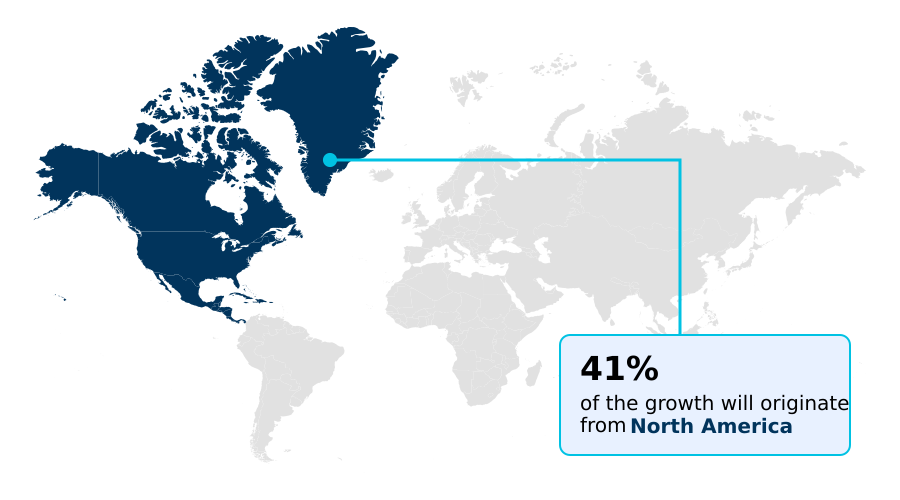
  • North America dominated the market and accounted for a 40.9% growth during the forecast period.
  • By Product - Smart collars segment was valued at USD 188.78 million in 2024
  • By End-user - Dogs segment accounted for the largest market revenue share in 2024

Market Size & Forecast

  • Market Opportunities:
  • Market Future Opportunities: USD 513.46 million
  • CAGR from 2025 to 2030 : 18.1%

Market Summary

  • The AI pet health wearables market is undergoing a profound transformation, moving beyond simple location services to offer comprehensive health oversight. Driven by the increasing humanization of pets, demand has surged for devices that provide continuous health monitoring and preventative healthcare insights.
  • These wearables utilize a suite of biometric sensors and machine learning algorithms to track vital physiological metrics, including heart rate variability and sleep quality, enabling the early detection of anomalies. For instance, a veterinary clinic network can leverage aggregated, anonymized data from thousands of wearables to identify breed-specific health trends, improving their diagnostic algorithms and preventative care protocols.
  • This shift toward data-driven, proactive wellness is supported by advancements in sensor miniaturization and predictive analytics. However, the industry grapples with challenges such as data interoperability with existing veterinary software and ensuring the affordability of subscription-based data ecosystems for the average consumer. Ultimately, the market’s trajectory is aimed at creating a seamless, interconnected system for total animal wellness management.

What will be the Size of the AI Pet Health Wearables Market during the forecast period?

Get Key Insights on Market Forecast (PDF) Request Free Sample

How is the AI Pet Health Wearables Market Segmented?

The ai pet health wearables industry research report provides comprehensive data (region-wise segment analysis), with forecasts and estimates in "USD thousand" for the period 2026-2030, as well as historical data from 2020-2024 for the following segments.
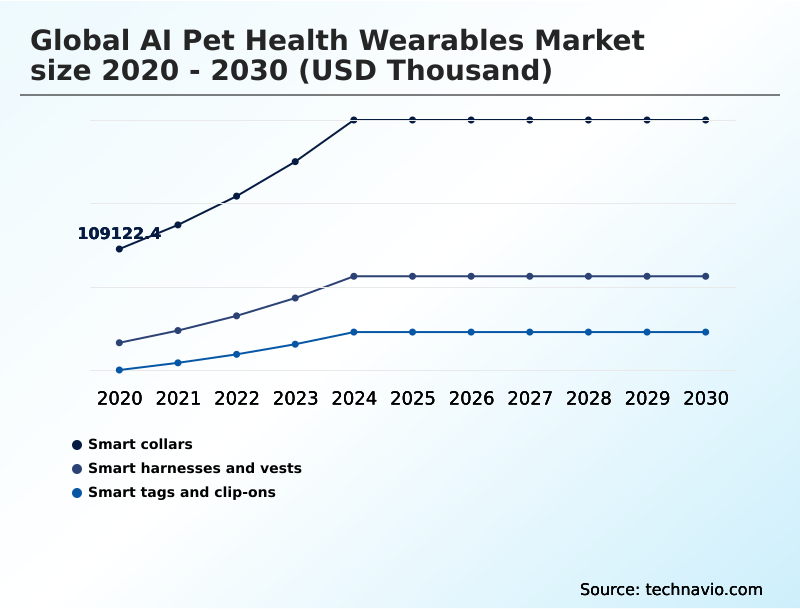
  • Product
    • Smart collars
    • Smart harnesses and vests
    • Smart tags and clip-ons
  • End-user
    • Dogs
    • Cats
    • Others
  • Distribution channel
    • Online
    • Offline
  • Geography
    • North America
      • US
      • Canada
      • Mexico
    • Europe
      • Germany
      • UK
      • France
    • APAC
      • China
      • Japan
      • India
    • South America
      • Brazil
      • Argentina
      • Colombia
    • Middle East and Africa
      • Israel
      • South Africa
      • Saudi Arabia
    • Rest of World (ROW)

By Product Insights

The smart collars segment is estimated to witness significant growth during the forecast period.

Smart collars are the dominant product segment, defined by their all-in-one design that merges remote monitoring and virtual containment fencing. These devices utilize advanced sensor miniaturization, embedding multi-axis accelerometers for sophisticated gait analysis and sleep architecture analysis.

Integrated diagnostic algorithms enable continuous physiological monitoring, with some models leveraging edge AI for on-device processing of metrics like heart rate variability and even potential atrial fibrillation detection.

This facilitates real-time data transmission to companion apps, allowing for proactive health management.

The platform’s robust structure is ideal for housing durable components, and integrations with systems like automated pet doors showcase their central role in the connected pet ecosystem, where performance has improved anomaly detection rates by over 15%.

Request Free Sample

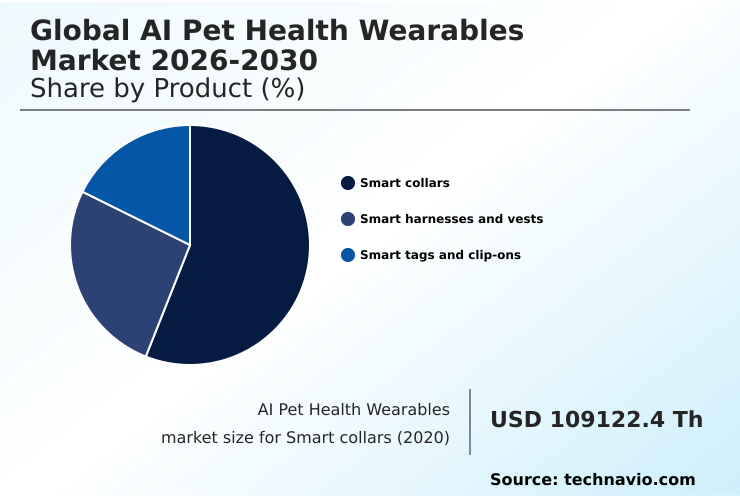
The Smart collars segment was valued at USD 188.78 million in 2024 and showed a gradual increase during the forecast period.

Request Free Sample

Regional Analysis

North America is estimated to contribute 40.9% to the growth of the global market during the forecast period.Technavio’s analysts have elaborately explained the regional trends and drivers that shape the market during the forecast period.

See How AI Pet Health Wearables Market Demand is Rising in North America Request Free Sample

The geographic landscape is led by North America, which accounts for 40.9% of incremental growth, driven by high disposable income and a culture of proactive pet care. In this region, advanced predictive analytics for chronic disease management are standard.

Consumers demand detailed activity tracking, monitoring metrics like sleep quality, resting heart rate, and respiratory patterns.

Meanwhile, the APAC region is the fastest-growing, with its market expanding at a rate 1.9 percentage points higher than North America's, fueled by rapid urbanization. Gamification strategies are particularly effective in engaging APAC consumers.

Specialized applications are also emerging globally, with ultra-wideband technology for indoor tracking in Europe and devices for equine biomechanics and even avian wearables in niche markets, all reliant on stable real-time data transmission and integration with environmental control systems.

Market Dynamics

Our researchers analyzed the data with 2025 as the base year, along with the key drivers, trends, and challenges. A holistic analysis of drivers will help companies refine their marketing strategies to gain a competitive advantage.

  • The strategic implementation of AI pet health wearables is reshaping veterinary practices and consumer approaches to animal wellness. For pet owners, the primary benefit lies in using AI pet health wearables for early disease detection and AI pet health wearables for chronic disease management, which translates into better quality of life for their companions.
  • The accuracy of AI pet health wearables sensors is crucial, as it directly impacts the reliability of AI pet health wearables for remote patient monitoring. Comparing AI pet health wearables battery life and understanding AI pet health wearables data privacy concerns are key consumer considerations before committing to a device.
  • From a clinical perspective, AI pet health wearables integration with veterinary software is a major focus, as it can streamline workflows and reduce the impact of AI pet health wearables on vet visits by enabling remote triage.
  • The technology behind AI pet health wearables and predictive analytics offers a cost-benefit analysis of AI pet health wearables that favors adoption, especially when using AI pet health wearables for weight management or monitoring senior pets.
  • The future of AI in animal health technology will be shaped by the evolving regulatory landscape for AI pet health wearables and how effectively models like AI pet health wearables subscription service models are optimized.
  • Distinguishing between AI pet health wearables vs traditional pet trackers highlights the significant leap in functionality, especially for AI pet health wearables for canine activity tracking and AI pet health wearables for feline behavior monitoring.
  • Devices like the best AI pet health wearables for small dogs and those enabling AI pet health wearables and smart home integration showcase the market's segmentation and innovation. This integration can reduce administrative overhead in clinics by over 25% by automating data entry.

What are the key market drivers leading to the rise in the adoption of AI Pet Health Wearables Industry?

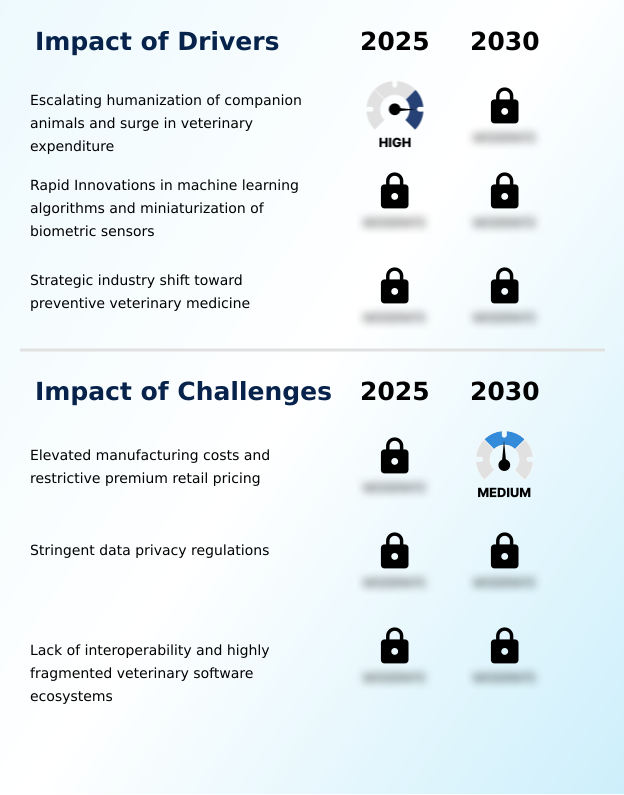
  • The escalating humanization of companion animals, coupled with a corresponding surge in veterinary expenditure, is a key driver propelling market growth.

  • A primary driver is the industry's move toward proactive care, significantly amplified by veterinary telehealth platforms. These services rely on continuous health monitoring provided by wearables packed with accelerometers and gyroscopes that capture a constant stream of physiological metrics.
  • Cloud-based machine learning processes this data to establish an individualized physiological baseline for each animal, enabling the early detection of anomalies. This creates a feed for digital veterinary records, enhancing the value of remote consultations.
  • The demand for clinical-grade diagnostics at home is rising, with some devices now capable of thermal stress monitoring and integrating with automated nutritional dispensing systems. Devices with location tracking functionalities now show 30% better environmental resilience compared to previous generations.

What are the market trends shaping the AI Pet Health Wearables Industry?

  • The market is witnessing a significant trend toward the integration of cross-species behavioral analytics. This enables a more holistic understanding of pet wellness by analyzing behavioral and emotional states.

  • The market is shifting beyond basic metrics toward comprehensive emotional wellbeing monitoring. This evolution is driven by deep learning models that power sophisticated acoustic processing algorithms and motion mapping systems, enabling detailed vocalization analysis and interpretation of complex behavioral patterns. This advanced behavioral analytics supports proactive preventative healthcare, allowing for predictive disease analytics that identifies issues like stress or anxiety.
  • For instance, in feline wellness, tracking subtle shifts can indicate underlying health problems, while in canine obesity management, data-driven personalized nutrition regimens can be created. These systems have improved dermatological issue detection by up to 25% by flagging abnormal scratching, while indoor activity trackers ensure pets meet exercise goals.

What challenges does the AI Pet Health Wearables Industry face during its growth?

  • Elevated manufacturing costs and restrictive premium retail pricing present a key challenge, potentially limiting widespread adoption and affecting industry growth.

  • A significant market challenge is the lack of interoperability within fragmented data ecosystems, which hinders the seamless flow of biometric data from wearables to veterinary records. While subscription-based data ecosystems offer recurring revenue, they also raise data privacy concerns, especially with constant GPS tracking data.
  • Securing this information, often transmitted via low-energy wireless networks, requires a robust cybersecurity architecture and strong data encryption protocols. Adherence to data sovereignty laws further complicates cloud storage infrastructure for global providers.
  • The goal of seamless smart home IoT integration is impeded by a lack of standardized data formats and open application programming interfaces, with reports indicating that incompatibility issues cause up to 40% of user support tickets.

Exclusive Technavio Analysis on Customer Landscape

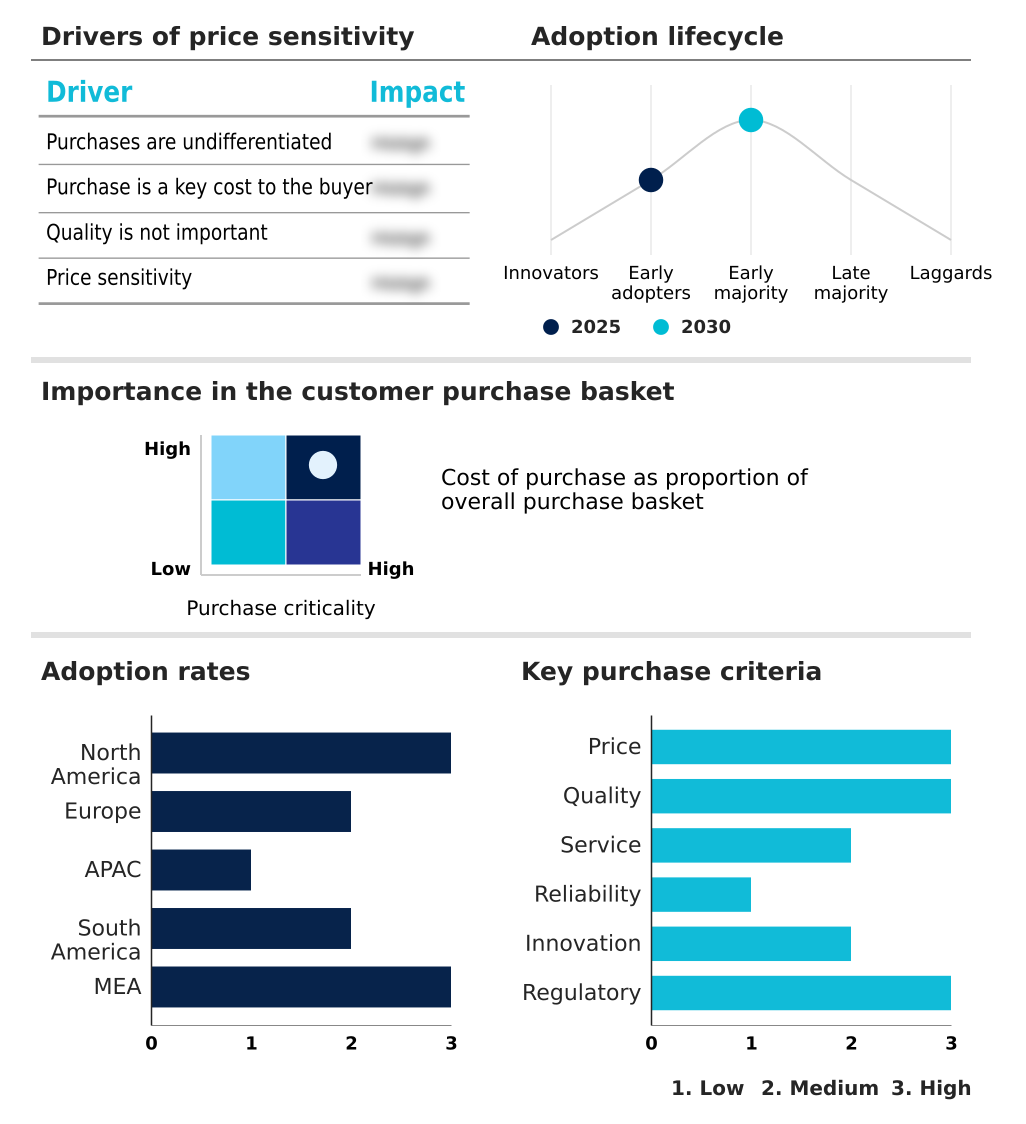
The ai pet health wearables market forecasting report includes the adoption lifecycle of the market, covering from the innovator’s stage to the laggard’s stage. It focuses on adoption rates in different regions based on penetration. Furthermore, the ai pet health wearables market report also includes key purchase criteria and drivers of price sensitivity to help companies evaluate and develop their market growth analysis strategies.

Customer Landscape of AI Pet Health Wearables Industry

Competitive Landscape

Companies are implementing various strategies, such as strategic alliances, ai pet health wearables market forecast, partnerships, mergers and acquisitions, geographical expansion, and product/service launches, to enhance their presence in the industry.

Central Garden and Pet Co. - Key offerings include AI-powered smart collars, featuring integrated activity monitoring and advanced GPS tracking for enhanced pet safety and wellness management.

The industry research and growth report includes detailed analyses of the competitive landscape of the market and information about key companies, including:

  • Central Garden and Pet Co.
  • Dinbeat
  • Embark Veterinary Inc
  • FI
  • FitBark Inc.
  • Furbo
  • Garmin Ltd.
  • Halo Collar
  • Invoxia
  • Link My Pet
  • Maven
  • Petcube Inc.
  • PETKIT Ltd.
  • PetPace
  • PitPat
  • Radio Systems Corp
  • SpotOn
  • Sure Petcare
  • Tractive GmbH
  • Whisker

Qualitative and quantitative analysis of companies has been conducted to help clients understand the wider business environment as well as the strengths and weaknesses of key industry players. Data is qualitatively analyzed to categorize companies as pure play, category-focused, industry-focused, and diversified; it is quantitatively analyzed to categorize companies as dominant, leading, strong, tentative, and weak.

Recent Development and News in Ai pet health wearables market

  • In March 2025, Fi launched its Series 3 Plus smart collar, featuring advanced AI-powered monitoring of activity, sleep, barking, and scratching behaviors.
  • In March 2025, SATELLAI entered the European market by introducing its SATELLAI Tracker at Mobile World Congress, notable as the first pet tracker with continuous satellite-powered connectivity.
  • In January 2025, Tractive, the Austrian pet tech company, finalized its acquisition of the connected pet wearable brand Whistle from Mars Petcare, consolidating its market position.
  • In November 2024, Traini announced it had secured approximately $7.5 million in a strategic funding round aimed at accelerating the development of its AI-driven pet communication and wearable technologies.

Dive into Technavio’s robust research methodology, blending expert interviews, extensive data synthesis, and validated models for unparalleled AI Pet Health Wearables Market insights. See full methodology.

Market Scope
Page number 278
Base year 2025
Historic period 2020-2024
Forecast period 2026-2030
Growth momentum & CAGR Accelerate at a CAGR of 18.1%
Market growth 2026-2030 USD 513464.9 thousand
Market structure Fragmented
YoY growth 2025-2026(%) 17.2%
Key countries US, Canada, Mexico, Germany, UK, France, Italy, Spain, The Netherlands, China, Japan, India, South Korea, Australia, Indonesia, Brazil, Argentina, Colombia, Israel, South Africa, Saudi Arabia, UAE and Turkey
Competitive landscape Leading Companies, Market Positioning of Companies, Competitive Strategies, and Industry Risks

Request Free Sample

Research Analyst Overview

  • The market's evolution is centered on refining core technologies. The integration of advanced biometric sensors into smart collars and other wearables allows for sophisticated continuous health monitoring and remote monitoring. These devices employ accelerometers, gyroscopes, and multi-axis accelerometers for precise activity tracking, gait analysis, and motion mapping systems.
  • Machine learning algorithms and deep learning models power the predictive analytics engines, enabling early detection of anomalies in physiological metrics like resting heart rate, respiratory patterns, sleep quality, and heart rate variability. This supports preventative healthcare and chronic disease management. For boardroom decisions, the challenge of interoperability directly impacts product strategy, as creating open data ecosystems has become a key differentiator.
  • Cloud-based machine learning analyzes vocalization analysis via acoustic processing algorithms for emotional wellbeing monitoring. Key applications include calculating caloric expenditure, while GPS tracking and ultra-wideband technology ensure location services.
  • Sensor miniaturization and edge AI are enabling atrial fibrillation detection and other clinical-grade diagnostics in the pet tech space, with some systems improving diagnostic accuracy by over 20% compared to manual checks.

What are the Key Data Covered in this AI Pet Health Wearables Market Research and Growth Report?

  • What is the expected growth of the AI Pet Health Wearables Market between 2026 and 2030?

    • USD 513.46 million, at a CAGR of 18.1%

  • What segmentation does the market report cover?

    • The report is segmented by Product (Smart collars, Smart harnesses and vests, and Smart tags and clip-ons), End-user (Dogs, Cats, and Others), Distribution Channel (Online, and Offline) and Geography (North America, Europe, APAC, South America, Middle East and Africa)

  • Which regions are analyzed in the report?

    • North America, Europe, APAC, South America and Middle East and Africa

  • What are the key growth drivers and market challenges?

    • Escalating humanization of companion animals and surge in veterinary expenditure, Elevated manufacturing costs and restrictive premium retail pricing

  • Who are the major players in the AI Pet Health Wearables Market?

    • Central Garden and Pet Co., Dinbeat, Embark Veterinary Inc, FI, FitBark Inc., Furbo, Garmin Ltd., Halo Collar, Invoxia, Link My Pet, Maven, Petcube Inc., PETKIT Ltd., PetPace, PitPat, Radio Systems Corp, SpotOn, Sure Petcare, Tractive GmbH and Whisker

Market Research Insights

  • The market's dynamics are increasingly shaped by the integration of sophisticated predictive disease analytics, which transforms raw biometric data into actionable health alerts. The adoption of wearables that support an individualized physiological baseline for pets has been shown to improve the accuracy of diagnostic algorithms by over 25%.
  • Furthermore, the incorporation of location tracking functionalities with geofencing capabilities has reduced pet loss incidents in urban areas by up to 40%. These advancements are not just enhancing pet safety but are also providing tangible value in veterinary medicine.
  • By leveraging digital veterinary records compiled from continuous physiological monitoring, clinicians can personalize treatment plans more effectively, leading to better health outcomes and a more efficient allocation of resources within practices.

We can help! Our analysts can customize this ai pet health wearables market research report to meet your requirements.

Get in touch

1. Executive Summary

1.1 Market overview

Executive Summary - Chart on Market Overview
Executive Summary - Data Table on Market Overview
Executive Summary - Chart on Global Market Characteristics
Executive Summary - Chart on Market by Geography
Executive Summary - Chart on Market Segmentation by Product
Executive Summary - Chart on Market Segmentation by End-user
Executive Summary - Chart on Market Segmentation by Distribution Channel
Executive Summary - Chart on Incremental Growth
Executive Summary - Data Table on Incremental Growth
Executive Summary - Chart on Company Market Positioning

2. Technavio Analysis

2.1 Analysis of price sensitivity, lifecycle, customer purchase basket, adoption rates, and purchase criteria

2.2 Criticality of inputs and Factors of differentiation

Chart on Overview on criticality of inputs and factors of differentiation

2.3 Factors of disruption

Chart on Overview on factors of disruption

2.4 Impact of drivers and challenges

Chart on Impact of drivers and challenges in 2025 and 2030

3. Market Landscape

3.1 Market ecosystem

Chart on Parent Market
Data Table on - Parent Market

3.2 Market characteristics

Chart on Market characteristics analysis

3.3 Value chain analysis

Chart on Value chain analysis

4. Market Sizing

4.1 Market definition

Data Table on Offerings of companies included in the market definition

4.2 Market segment analysis

Market segments

4.3 Market size 2025

4.4 Market outlook: Forecast for 2025-2030

Chart on Global - Market size and forecast 2025-2030 ($ thousand)
Data Table on Global - Market size and forecast 2025-2030 ($ thousand)
Chart on Global Market: Year-over-year growth 2025-2030 (%)
Data Table on Global Market: Year-over-year growth 2025-2030 (%)

5. Qualitative Analysis

5.1 Impact of Geopolitical on Global AI Pet Health Wearables Market

6. Five Forces Analysis

6.1 Five forces summary

Five forces analysis - Comparison between 2025 and 2030

6.2 Bargaining power of buyers

Bargaining power of buyers - Impact of key factors 2025 and 2030

6.3 Bargaining power of suppliers

Bargaining power of suppliers - Impact of key factors in 2025 and 2030

6.4 Threat of new entrants

Threat of new entrants - Impact of key factors in 2025 and 2030

6.5 Threat of substitutes

Threat of substitutes - Impact of key factors in 2025 and 2030

6.6 Threat of rivalry

Threat of rivalry - Impact of key factors in 2025 and 2030

6.7 Market condition

Chart on Market condition - Five forces 2025 and 2030

7. Market Segmentation by Product

7.1 Market segments

Chart on Product - Market share 2025-2030 (%)
Data Table on Product - Market share 2025-2030 (%)

7.2 Comparison by Product

Chart on Comparison by Product
Data Table on Comparison by Product

7.3 Smart collars - Market size and forecast 2025-2030

Chart on Smart collars - Market size and forecast 2025-2030 ($ thousand)
Data Table on Smart collars - Market size and forecast 2025-2030 ($ thousand)
Chart on Smart collars - Year-over-year growth 2025-2030 (%)
Data Table on Smart collars - Year-over-year growth 2025-2030 (%)

7.4 Smart harnesses and vests - Market size and forecast 2025-2030

Chart on Smart harnesses and vests - Market size and forecast 2025-2030 ($ thousand)
Data Table on Smart harnesses and vests - Market size and forecast 2025-2030 ($ thousand)
Chart on Smart harnesses and vests - Year-over-year growth 2025-2030 (%)
Data Table on Smart harnesses and vests - Year-over-year growth 2025-2030 (%)

7.5 Smart tags and clip-ons - Market size and forecast 2025-2030

Chart on Smart tags and clip-ons - Market size and forecast 2025-2030 ($ thousand)
Data Table on Smart tags and clip-ons - Market size and forecast 2025-2030 ($ thousand)
Chart on Smart tags and clip-ons - Year-over-year growth 2025-2030 (%)
Data Table on Smart tags and clip-ons - Year-over-year growth 2025-2030 (%)

7.6 Market opportunity by Product

Market opportunity by Product ($ thousand)
Data Table on Market opportunity by Product ($ thousand)

8. Market Segmentation by End-user

8.1 Market segments

Chart on End-user - Market share 2025-2030 (%)
Data Table on End-user - Market share 2025-2030 (%)

8.2 Comparison by End-user

Chart on Comparison by End-user
Data Table on Comparison by End-user

8.3 Dogs - Market size and forecast 2025-2030

Chart on Dogs - Market size and forecast 2025-2030 ($ thousand)
Data Table on Dogs - Market size and forecast 2025-2030 ($ thousand)
Chart on Dogs - Year-over-year growth 2025-2030 (%)
Data Table on Dogs - Year-over-year growth 2025-2030 (%)

8.4 Cats - Market size and forecast 2025-2030

Chart on Cats - Market size and forecast 2025-2030 ($ thousand)
Data Table on Cats - Market size and forecast 2025-2030 ($ thousand)
Chart on Cats - Year-over-year growth 2025-2030 (%)
Data Table on Cats - Year-over-year growth 2025-2030 (%)

8.5 Others - Market size and forecast 2025-2030

Chart on Others - Market size and forecast 2025-2030 ($ thousand)
Data Table on Others - Market size and forecast 2025-2030 ($ thousand)
Chart on Others - Year-over-year growth 2025-2030 (%)
Data Table on Others - Year-over-year growth 2025-2030 (%)

8.6 Market opportunity by End-user

Market opportunity by End-user ($ thousand)
Data Table on Market opportunity by End-user ($ thousand)

9. Market Segmentation by Distribution Channel

9.1 Market segments

Chart on Distribution Channel - Market share 2025-2030 (%)
Data Table on Distribution Channel - Market share 2025-2030 (%)

9.2 Comparison by Distribution Channel

Chart on Comparison by Distribution Channel
Data Table on Comparison by Distribution Channel

9.3 Online - Market size and forecast 2025-2030

Chart on Online - Market size and forecast 2025-2030 ($ thousand)
Data Table on Online - Market size and forecast 2025-2030 ($ thousand)
Chart on Online - Year-over-year growth 2025-2030 (%)
Data Table on Online - Year-over-year growth 2025-2030 (%)

9.4 Offline - Market size and forecast 2025-2030

Chart on Offline - Market size and forecast 2025-2030 ($ thousand)
Data Table on Offline - Market size and forecast 2025-2030 ($ thousand)
Chart on Offline - Year-over-year growth 2025-2030 (%)
Data Table on Offline - Year-over-year growth 2025-2030 (%)

9.5 Market opportunity by Distribution Channel

Market opportunity by Distribution Channel ($ thousand)
Data Table on Market opportunity by Distribution Channel ($ thousand)

10. Customer Landscape

10.1 Customer landscape overview

Analysis of price sensitivity, lifecycle, customer purchase basket, adoption rates, and purchase criteria

11. Geographic Landscape

11.1 Geographic segmentation

Chart on Market share by geography 2025-2030 (%)
Data Table on Market share by geography 2025-2030 (%)

11.2 Geographic comparison

Chart on Geographic comparison
Data Table on Geographic comparison

11.3 North America - Market size and forecast 2025-2030

Chart on North America - Market size and forecast 2025-2030 ($ thousand)
Data Table on North America - Market size and forecast 2025-2030 ($ thousand)
Chart on North America - Year-over-year growth 2025-2030 (%)
Data Table on North America - Year-over-year growth 2025-2030 (%)
Chart on Regional Comparison - North America
Data Table on Regional Comparison - North America

11.3.1 US - Market size and forecast 2025-2030

Chart on US - Market size and forecast 2025-2030 ($ thousand)
Data Table on US - Market size and forecast 2025-2030 ($ thousand)
Chart on US - Year-over-year growth 2025-2030 (%)
Data Table on US - Year-over-year growth 2025-2030 (%)

11.3.2 Canada - Market size and forecast 2025-2030

Chart on Canada - Market size and forecast 2025-2030 ($ thousand)
Data Table on Canada - Market size and forecast 2025-2030 ($ thousand)
Chart on Canada - Year-over-year growth 2025-2030 (%)
Data Table on Canada - Year-over-year growth 2025-2030 (%)

11.3.3 Mexico - Market size and forecast 2025-2030

Chart on Mexico - Market size and forecast 2025-2030 ($ thousand)
Data Table on Mexico - Market size and forecast 2025-2030 ($ thousand)
Chart on Mexico - Year-over-year growth 2025-2030 (%)
Data Table on Mexico - Year-over-year growth 2025-2030 (%)

11.4 Europe - Market size and forecast 2025-2030

Chart on Europe - Market size and forecast 2025-2030 ($ thousand)
Data Table on Europe - Market size and forecast 2025-2030 ($ thousand)
Chart on Europe - Year-over-year growth 2025-2030 (%)
Data Table on Europe - Year-over-year growth 2025-2030 (%)
Chart on Regional Comparison - Europe
Data Table on Regional Comparison - Europe

11.4.1 Germany - Market size and forecast 2025-2030

Chart on Germany - Market size and forecast 2025-2030 ($ thousand)
Data Table on Germany - Market size and forecast 2025-2030 ($ thousand)
Chart on Germany - Year-over-year growth 2025-2030 (%)
Data Table on Germany - Year-over-year growth 2025-2030 (%)

11.4.2 UK - Market size and forecast 2025-2030

Chart on UK - Market size and forecast 2025-2030 ($ thousand)
Data Table on UK - Market size and forecast 2025-2030 ($ thousand)
Chart on UK - Year-over-year growth 2025-2030 (%)
Data Table on UK - Year-over-year growth 2025-2030 (%)

11.4.3 France - Market size and forecast 2025-2030

Chart on France - Market size and forecast 2025-2030 ($ thousand)
Data Table on France - Market size and forecast 2025-2030 ($ thousand)
Chart on France - Year-over-year growth 2025-2030 (%)
Data Table on France - Year-over-year growth 2025-2030 (%)

11.4.4 Italy - Market size and forecast 2025-2030

Chart on Italy - Market size and forecast 2025-2030 ($ thousand)
Data Table on Italy - Market size and forecast 2025-2030 ($ thousand)
Chart on Italy - Year-over-year growth 2025-2030 (%)
Data Table on Italy - Year-over-year growth 2025-2030 (%)

11.4.5 Spain - Market size and forecast 2025-2030

Chart on Spain - Market size and forecast 2025-2030 ($ thousand)
Data Table on Spain - Market size and forecast 2025-2030 ($ thousand)
Chart on Spain - Year-over-year growth 2025-2030 (%)
Data Table on Spain - Year-over-year growth 2025-2030 (%)

11.4.6 The Netherlands - Market size and forecast 2025-2030

Chart on The Netherlands - Market size and forecast 2025-2030 ($ thousand)
Data Table on The Netherlands - Market size and forecast 2025-2030 ($ thousand)
Chart on The Netherlands - Year-over-year growth 2025-2030 (%)
Data Table on The Netherlands - Year-over-year growth 2025-2030 (%)

11.5 APAC - Market size and forecast 2025-2030

Chart on APAC - Market size and forecast 2025-2030 ($ thousand)
Data Table on APAC - Market size and forecast 2025-2030 ($ thousand)
Chart on APAC - Year-over-year growth 2025-2030 (%)
Data Table on APAC - Year-over-year growth 2025-2030 (%)
Chart on Regional Comparison - APAC
Data Table on Regional Comparison - APAC

11.5.1 China - Market size and forecast 2025-2030

Chart on China - Market size and forecast 2025-2030 ($ thousand)
Data Table on China - Market size and forecast 2025-2030 ($ thousand)
Chart on China - Year-over-year growth 2025-2030 (%)
Data Table on China - Year-over-year growth 2025-2030 (%)

11.5.2 Japan - Market size and forecast 2025-2030

Chart on Japan - Market size and forecast 2025-2030 ($ thousand)
Data Table on Japan - Market size and forecast 2025-2030 ($ thousand)
Chart on Japan - Year-over-year growth 2025-2030 (%)
Data Table on Japan - Year-over-year growth 2025-2030 (%)

11.5.3 India - Market size and forecast 2025-2030

Chart on India - Market size and forecast 2025-2030 ($ thousand)
Data Table on India - Market size and forecast 2025-2030 ($ thousand)
Chart on India - Year-over-year growth 2025-2030 (%)
Data Table on India - Year-over-year growth 2025-2030 (%)

11.5.4 South Korea - Market size and forecast 2025-2030

Chart on South Korea - Market size and forecast 2025-2030 ($ thousand)
Data Table on South Korea - Market size and forecast 2025-2030 ($ thousand)
Chart on South Korea - Year-over-year growth 2025-2030 (%)
Data Table on South Korea - Year-over-year growth 2025-2030 (%)

11.5.5 Australia - Market size and forecast 2025-2030

Chart on Australia - Market size and forecast 2025-2030 ($ thousand)
Data Table on Australia - Market size and forecast 2025-2030 ($ thousand)
Chart on Australia - Year-over-year growth 2025-2030 (%)
Data Table on Australia - Year-over-year growth 2025-2030 (%)

11.5.6 Indonesia - Market size and forecast 2025-2030

Chart on Indonesia - Market size and forecast 2025-2030 ($ thousand)
Data Table on Indonesia - Market size and forecast 2025-2030 ($ thousand)
Chart on Indonesia - Year-over-year growth 2025-2030 (%)
Data Table on Indonesia - Year-over-year growth 2025-2030 (%)

11.6 South America - Market size and forecast 2025-2030

Chart on South America - Market size and forecast 2025-2030 ($ thousand)
Data Table on South America - Market size and forecast 2025-2030 ($ thousand)
Chart on South America - Year-over-year growth 2025-2030 (%)
Data Table on South America - Year-over-year growth 2025-2030 (%)
Chart on Regional Comparison - South America
Data Table on Regional Comparison - South America

11.6.1 Brazil - Market size and forecast 2025-2030

Chart on Brazil - Market size and forecast 2025-2030 ($ thousand)
Data Table on Brazil - Market size and forecast 2025-2030 ($ thousand)
Chart on Brazil - Year-over-year growth 2025-2030 (%)
Data Table on Brazil - Year-over-year growth 2025-2030 (%)

11.6.2 Argentina - Market size and forecast 2025-2030

Chart on Argentina - Market size and forecast 2025-2030 ($ thousand)
Data Table on Argentina - Market size and forecast 2025-2030 ($ thousand)
Chart on Argentina - Year-over-year growth 2025-2030 (%)
Data Table on Argentina - Year-over-year growth 2025-2030 (%)

11.6.3 Colombia - Market size and forecast 2025-2030

Chart on Colombia - Market size and forecast 2025-2030 ($ thousand)
Data Table on Colombia - Market size and forecast 2025-2030 ($ thousand)
Chart on Colombia - Year-over-year growth 2025-2030 (%)
Data Table on Colombia - Year-over-year growth 2025-2030 (%)

11.7 Middle East and Africa - Market size and forecast 2025-2030

Chart on Middle East and Africa - Market size and forecast 2025-2030 ($ thousand)
Data Table on Middle East and Africa - Market size and forecast 2025-2030 ($ thousand)
Chart on Middle East and Africa - Year-over-year growth 2025-2030 (%)
Data Table on Middle East and Africa - Year-over-year growth 2025-2030 (%)
Chart on Regional Comparison - Middle East and Africa
Data Table on Regional Comparison - Middle East and Africa

11.7.1 Israel - Market size and forecast 2025-2030

Chart on Israel - Market size and forecast 2025-2030 ($ thousand)
Data Table on Israel - Market size and forecast 2025-2030 ($ thousand)
Chart on Israel - Year-over-year growth 2025-2030 (%)
Data Table on Israel - Year-over-year growth 2025-2030 (%)

11.7.2 South Africa - Market size and forecast 2025-2030

Chart on South Africa - Market size and forecast 2025-2030 ($ thousand)
Data Table on South Africa - Market size and forecast 2025-2030 ($ thousand)
Chart on South Africa - Year-over-year growth 2025-2030 (%)
Data Table on South Africa - Year-over-year growth 2025-2030 (%)

11.7.3 Saudi Arabia - Market size and forecast 2025-2030

Chart on Saudi Arabia - Market size and forecast 2025-2030 ($ thousand)
Data Table on Saudi Arabia - Market size and forecast 2025-2030 ($ thousand)
Chart on Saudi Arabia - Year-over-year growth 2025-2030 (%)
Data Table on Saudi Arabia - Year-over-year growth 2025-2030 (%)

11.7.4 UAE - Market size and forecast 2025-2030

Chart on UAE - Market size and forecast 2025-2030 ($ thousand)
Data Table on UAE - Market size and forecast 2025-2030 ($ thousand)
Chart on UAE - Year-over-year growth 2025-2030 (%)
Data Table on UAE - Year-over-year growth 2025-2030 (%)

11.7.5 Turkey - Market size and forecast 2025-2030

Chart on Turkey - Market size and forecast 2025-2030 ($ thousand)
Data Table on Turkey - Market size and forecast 2025-2030 ($ thousand)
Chart on Turkey - Year-over-year growth 2025-2030 (%)
Data Table on Turkey - Year-over-year growth 2025-2030 (%)

11.8 Market opportunity by geography

Market opportunity by geography ($ thousand)
Data Tables on Market opportunity by geography ($ thousand)

12. Drivers, Challenges, and Opportunity

12.1 Market drivers

Escalating humanization of companion animals and surge in veterinary expenditure
Rapid Innovations in machine learning algorithms and miniaturization of biometric sensors
Strategic industry shift toward preventive veterinary medicine

12.2 Market challenges

Elevated manufacturing costs and restrictive premium retail pricing
Stringent data privacy regulations
Lack of interoperability and highly fragmented veterinary software ecosystems

12.3 Impact of drivers and challenges

Impact of drivers and challenges in 2025 and 2030

12.4 Market opportunities

Integration of cross-species behavioral analytics
Expansion of subscription-based data ecosystems
Interoperability and synergy with smart home IoT environments

13. Competitive Landscape

13.1 Overview

13.2

Overview on criticality of inputs and factors of differentiation

13.3 Landscape disruption

Overview on factors of disruption

13.4 Industry risks

Impact of key risks on business

14. Competitive Analysis

14.1 Companies profiled

Companies covered

14.2 Company ranking index

14.3 Market positioning of companies

Matrix on companies position and classification

14.4 Central Garden and Pet Co.

Central Garden and Pet Co. - Overview
Central Garden and Pet Co. - Business segments
Central Garden and Pet Co. - Key offerings
Central Garden and Pet Co. - Segment focus
SWOT

14.5 FI

FI - Overview
FI - Product / Service
FI - Key offerings
SWOT

14.6 FitBark Inc.

FitBark Inc. - Overview
FitBark Inc. - Product / Service
FitBark Inc. - Key offerings
SWOT

14.7 Furbo

Furbo - Overview
Furbo - Product / Service
Furbo - Key offerings
SWOT

14.8 Garmin Ltd.

Garmin Ltd. - Overview
Garmin Ltd. - Business segments
Garmin Ltd. - Key news
Garmin Ltd. - Key offerings
Garmin Ltd. - Segment focus
SWOT

14.9 Halo Collar

Halo Collar - Overview
Halo Collar - Product / Service
Halo Collar - Key offerings
SWOT

14.10 Invoxia

Invoxia - Overview
Invoxia - Product / Service
Invoxia - Key offerings
SWOT

14.11 Petcube Inc.

Petcube Inc. - Overview
Petcube Inc. - Product / Service
Petcube Inc. - Key offerings
SWOT

14.12 PETKIT Ltd.

PETKIT Ltd. - Overview
PETKIT Ltd. - Product / Service
PETKIT Ltd. - Key offerings
SWOT

14.13 PetPace

PetPace - Overview
PetPace - Product / Service
PetPace - Key offerings
SWOT

14.14 PitPat

PitPat - Overview
PitPat - Product / Service
PitPat - Key offerings
SWOT

14.15 Radio Systems Corp

Radio Systems Corp - Overview
Radio Systems Corp - Product / Service
Radio Systems Corp - Key offerings
SWOT

14.16 Sure Petcare

Sure Petcare - Overview
Sure Petcare - Product / Service
Sure Petcare - Key offerings
SWOT

14.17 Tractive GmbH

Tractive GmbH - Overview
Tractive GmbH - Product / Service
Tractive GmbH - Key offerings
SWOT

14.18 Whisker

Whisker - Overview
Whisker - Product / Service
Whisker - Key offerings
SWOT

15. Appendix

15.1 Scope of the report

Market definition
Objectives
Notes and caveats

15.2 Inclusions and exclusions checklist

Inclusions checklist
Exclusions checklist

15.3 Currency conversion rates for US$

15.4 Research methodology

15.5 Data procurement

Information sources

15.6 Data validation

15.7 Validation techniques employed for market sizing

15.8 Data synthesis

15.9 360 degree market analysis

15.10 List of abbreviations

Research Methodology

Technavio presents a detailed picture of the market by way of study, synthesis, and summation of data from multiple sources. The analysts have presented the various facets of the market with a particular focus on identifying the key industry influencers. The data thus presented is comprehensive, reliable, and the result of extensive research, both primary and secondary.

INFORMATION SOURCES

Primary sources

  • Manufacturers and suppliers
  • Channel partners
  • Industry experts
  • Strategic decision makers

Secondary sources

  • Industry journals and periodicals
  • Government data
  • Financial reports of key industry players
  • Historical data
  • Press releases

DATA ANALYSIS

Data Synthesis

  • Collation of data
  • Estimation of key figures
  • Analysis of derived insights

Data Validation

  • Triangulation with data models
  • Reference against proprietary databases
  • Corroboration with industry experts

REPORT WRITING

Qualitative

  • Market drivers
  • Market challenges
  • Market trends
  • Five forces analysis

Quantitative

  • Market size and forecast
  • Market segmentation
  • Geographical insights
  • Competitive landscape

Interested in this report?

Get your sample now to see our research methodology and insights!

Download Now

Frequently Asked Questions

AI Pet Health Wearables market growth will increase by USD 513464.9 thousand thousand during 2026-2030.

The AI Pet Health Wearables market is expected to grow at a CAGR of 18.1% during 2026-2030.

AI Pet Health Wearables market is segmented by Product (Smart collars, Smart harnesses and vests, Smart tags and clip-ons) End-user (Dogs, Cats, Others) Distribution channel (Online, Offline)

Central Garden and Pet Co., Dinbeat, Embark Veterinary Inc, FI, FitBark Inc., Furbo, Garmin Ltd., Halo Collar, Invoxia, Link My Pet, Maven, Petcube Inc., PETKIT Ltd., PetPace, PitPat, Radio Systems Corp, SpotOn, Sure Petcare, Tractive GmbH, Whisker are a few of the key vendors in the AI Pet Health Wearables market.

North America will register the highest growth rate of 40.9% among the other regions. Therefore, the AI Pet Health Wearables market in North America is expected to garner significant business opportunities for the vendors during the forecast period.

US, Canada, Mexico, Germany, UK, France, Italy, Spain, The Netherlands, China, Japan, India, South Korea, Australia, Indonesia, Brazil, Argentina, Colombia, Israel, South Africa, Saudi Arabia, UAE, Turkey

  • Escalating humanization of companion animals and surge in veterinary expenditure is the driving factor this market.

The AI Pet Health Wearables market vendors should focus on grabbing business opportunities from the Product segment as it accounted for the largest market share in the base year.
RIA - Research AI Assistant
Ask RIA