AI In Mergers And Acquisitions Market Analysis, Size, and Forecast 2025-2029: North America (US, Canada, and Mexico), Europe (Germany, UK, and France), APAC (China, Japan, and India), South America (Brazil, Argentina, and Colombia), Middle East and Africa (Saudi Arabia, UAE, and South Africa), and Rest of World (ROW)

AI In Mergers And Acquisitions Market Analysis, Size, and Forecast 2025-2029:
North America (US, Canada, and Mexico), Europe (Germany, UK, and France), APAC (China, Japan, and India), South America (Brazil, Argentina, and Colombia), Middle East and Africa (Saudi Arabia, UAE, and South Africa), and Rest of World (ROW)

Published: Dec 2025 309 Pages SKU: IRTNTR81105

Market Overview at a Glance

$2.53 B
Market Opportunity
37.5%
CAGR 2024 - 2029
37.3%
North America Growth
$336.8 Mn
Software segment 2023

AI In Mergers And Acquisitions Market Size 2025-2029

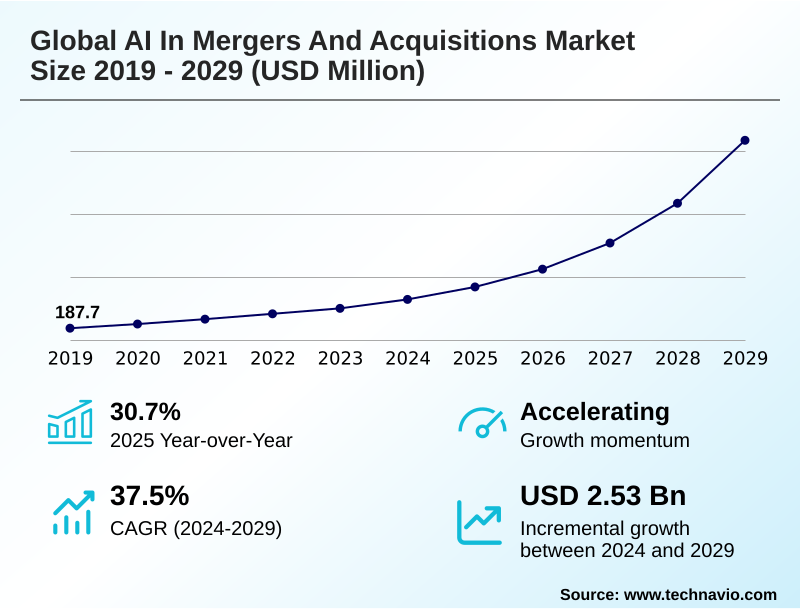
The ai in mergers and acquisitions market size is valued to increase by USD 2.53 billion, at a CAGR of 37.5% from 2024 to 2029. Enhanced due diligence efficiency and accuracy will drive the ai in mergers and acquisitions market.

Major Market Trends & Insights

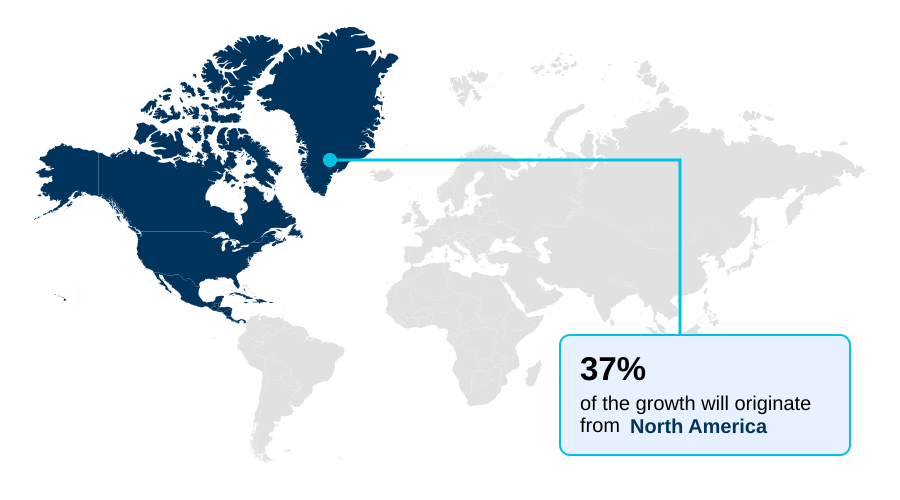
  • North America dominated the market and accounted for a 37.3% growth during the forecast period.
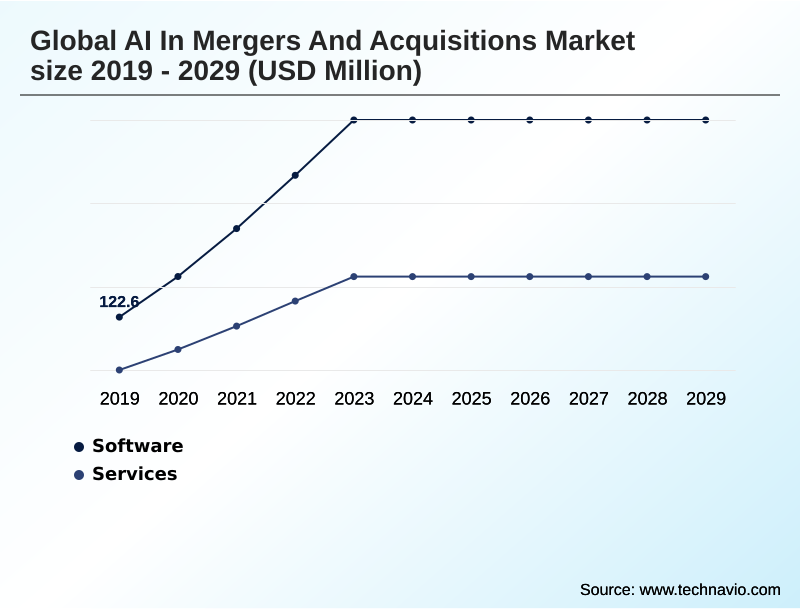
  • By Component - Software segment was valued at USD 336.8 million in 2023
  • By Deployment - Cloud-based segment accounted for the largest market revenue share in 2023

Market Size & Forecast

  • Market Opportunities: USD 2.99 billion
  • Market Future Opportunities: USD 2.53 billion
  • CAGR from 2024 to 2029 : 37.5%

Market Summary

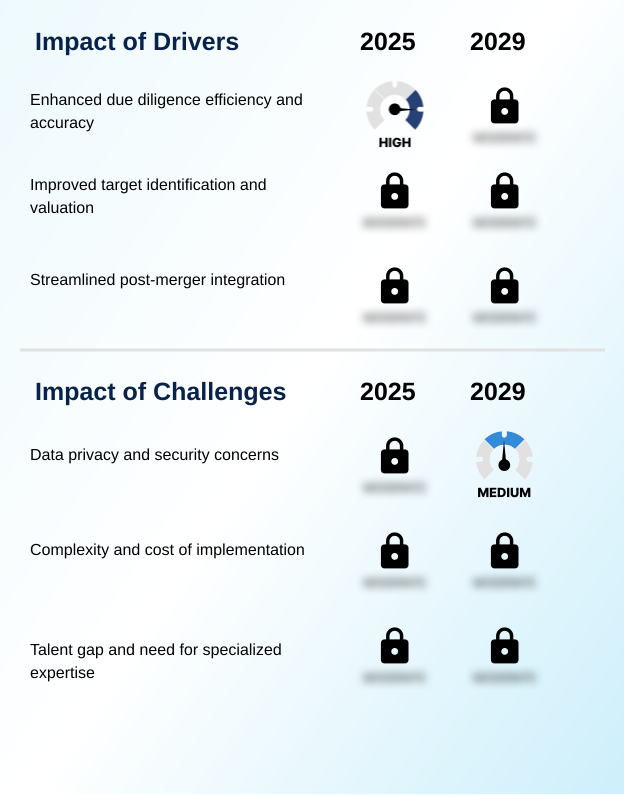
  • The AI in mergers and acquisitions market is undergoing a significant transformation, driven by technologies that enhance every phase of the deal lifecycle. Key market drivers include the need for enhanced due diligence efficiency and improved target identification. The integration of generative AI modeling is a primary trend, enabling firms to automate complex analyses and streamline workflows.
  • However, the market faces challenges related to data privacy, the high cost of implementation, and a notable talent gap in specialized expertise. For instance, a financial institution can leverage AI-powered due diligence platforms to analyze thousands of contracts for risk in a fraction of the time, a scenario where AI's speed and accuracy provide a distinct competitive advantage.
  • This shift toward data-driven decision-making is reshaping strategic imperatives, pushing firms to adopt advanced analytical tools to stay competitive in a complex dealmaking environment. The technology is not just an ancillary tool but is becoming a core component of corporate strategy.

What will be the Size of the AI In Mergers And Acquisitions Market during the forecast period?

Get Key Insights on Market Forecast (PDF) Request Free Sample

How is the AI In Mergers And Acquisitions Market Segmented?

The ai in mergers and acquisitions industry research report provides comprehensive data (region-wise segment analysis), with forecasts and estimates in "USD million" for the period 2025-2029, as well as historical data from 2019-2023 for the following segments.

  • Component
    • Software
    • Services
  • Deployment
    • Cloud-based
    • On-premises
  • End-user
    • BFSI
    • Healthcare
    • Consumer and retail
    • Manufacturing
    • Others
  • Geography
    • North America
      • US
      • Canada
      • Mexico
    • Europe
      • Germany
      • UK
      • France
    • APAC
      • China
      • Japan
      • India
    • South America
      • Brazil
      • Argentina
      • Colombia
    • Middle East and Africa
      • Saudi Arabia
      • UAE
      • South Africa
    • Rest of World (ROW)

By Component Insights

The software segment is estimated to witness significant growth during the forecast period.

The software segment is the core engine of the AI in mergers and acquisitions market, providing the platforms that enable deal lifecycle automation.

These solutions facilitate a more efficient mergers and acquisitions workflow through AI-driven workflow automation and automated document categorization. An AI-powered market intelligence platform is crucial for data-driven valuation and intellectual property analysis.

Firms are adopting these tools to achieve operational synergy identification and streamline the creation of documents like the confidential information memorandum.

With AI-powered forecasting tools, which an estimated 80% of practitioners expect to use, these platforms are transforming the transaction management solution landscape. The use of an AI-powered VDR is central to this shift, underpinning the entire data monetization strategy.

Request Free Sample

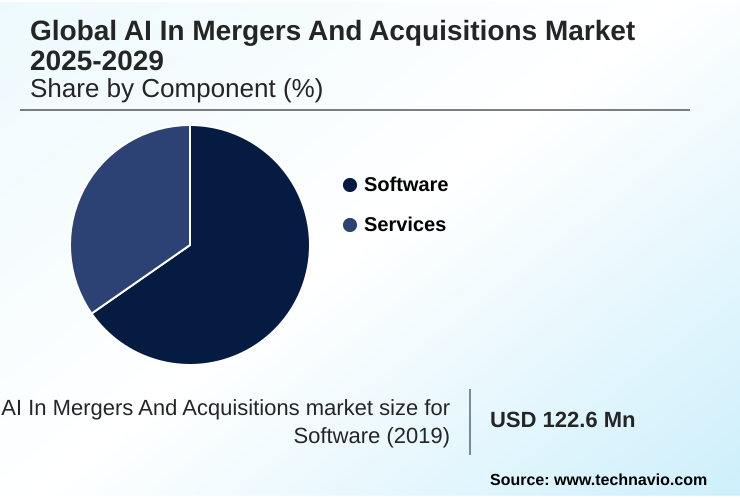
The Software segment was valued at USD 336.8 million in 2023 and showed a gradual increase during the forecast period.

Request Free Sample

Regional Analysis

North America is estimated to contribute 37.3% to the growth of the global market during the forecast period.Technavio’s analysts have elaborately explained the regional trends and drivers that shape the market during the forecast period.

See How AI In Mergers And Acquisitions Market Demand is Rising in North America Request Free Sample

The geographic landscape of the AI in mergers and acquisitions market is led by North America, where targets accounted for 61% of all global M&A value, making it a key digital transformation catalyst.

Firms in this region aggressively use AI for post-merger integration planning and synergy realization tracking. In Europe, the focus is on regulatory compliance navigation, with companies leveraging AI-powered background checks and AI-driven deal sourcing to navigate complex legal frameworks.

The APAC region is also a high-growth area, where AI facilitates cross-border transaction analysis and sentiment analysis to overcome cultural and language barriers. Across all regions, IT systems integration is a critical application.

The adoption of operational excellence tools and AI for portfolio management is becoming a global standard, with firms using AI-enhanced document structuring to improve efficiency, underscoring a worldwide shift in dealmaking strategy.

Market Dynamics

Our researchers analyzed the data with 2024 as the base year, along with the key drivers, trends, and challenges. A holistic analysis of drivers will help companies refine their marketing strategies to gain a competitive advantage.

  • The AI in mergers and acquisitions market is experiencing accelerated adoption, with a notable year-over-year growth rate exceeding 30%. This expansion is fueled by the strategic need to enhance corporate finance decisions. The role of AI in private equity deal sourcing is becoming particularly prominent, as firms seek a competitive advantage.
  • There is a growing reliance on using generative AI for due diligence reporting, which significantly streamlines the analysis phase. A key application is leveraging AI for cultural integration analysis, which helps mitigate post-deal risks. Furthermore, AI platforms for post-merger synergy tracking are critical for ensuring value creation.
  • Firms are increasingly using predictive analytics for off-market deal sourcing, uncovering opportunities that traditional methods miss. The impact of AI on deal negotiation strategy is substantial, as data-driven insights provide stronger bargaining positions. A core technical application involves natural language processing for contract review, which is more accurate than manual methods.
  • The use of AI tools for intellectual property valuation is transforming how technology assets are assessed. Within M&A, automating compliance checks with AI is now standard practice, as is the use of AI for supply chain synergy modeling. AI applications in cross-border M&A are essential for navigating diverse legal systems.
  • The adoption of machine learning for predicting deal success provides a quantitative basis for strategic choices. Organizations also utilize an AI-driven platform for target screening and for identifying revenue enhancement synergies, which automates KYC and AML in M&A. This is complemented by generative AI for creating deal marketing materials and real-time market intelligence using AI.
  • The implementation of AI models for dynamic company valuation is another critical development shaping the industry.

What are the key market drivers leading to the rise in the adoption of AI In Mergers And Acquisitions Industry?

  • Enhanced efficiency and accuracy in due diligence processes stand out as a key driver for market growth.

  • The primary market driver is the significant efficiency gained through AI-powered due diligence, which can accelerate transaction timelines by up to 50%. Technologies like natural language processing are used for automated contract review, providing actionable risk insights with high precision.
  • Deal sourcing automation, powered by algorithmic target screening and private market intelligence, is another key driver, allowing firms to uncover off-market opportunities. Predictive valuation models are delivering more accurate and defensible valuations.
  • AI-powered advisory services are leveraging these tools to enhance deal marketing automation and real-time deal monitoring. To ensure security, robust data room security protocols are essential.
  • The focus on AI model explainability is also growing, as dealmakers require transparency behind the analytical outputs that inform their high-stakes decisions.

What are the market trends shaping the AI In Mergers And Acquisitions Industry?

  • The ascendancy of generative AI in mergers and acquisitions processes is a dominant market trend. This technology is increasingly being integrated across the entire deal lifecycle, from sourcing to post-merger integration.

  • A dominant trend is the integration of generative AI modeling and AI-native platform intelligence across the deal lifecycle. This strategic acquisition driver is pushing firms toward data-driven dealmaking, where predictive deal sourcing identifies potential acquisition targets that conventional methods miss.
  • Adoption rates are climbing, with 80% of practitioners expecting to use these technologies for tasks like dynamic valuation modeling and AI-driven strategic simulation. In Europe, approximately 42% of firms are now leveraging AI, with a focus on cross-border transaction analysis and legal tech integration. The technology also supports cultural alignment analysis, which is critical for post-merger success.
  • The ability to generate proprietary deal flow using AI-powered market intelligence is creating a distinct competitive advantage for early adopters.

What challenges does the AI In Mergers And Acquisitions Industry face during its growth?

  • Significant concerns regarding data privacy and security present a key challenge affecting industry growth.

  • Significant challenges hinder widespread adoption, led by data security and compliance risk assessment. The total cost of ownership for AI solutions can be three to five times the initial software cost, creating a high barrier to entry.
  • There is also a critical need for AI talent upskilling, as the demand for specialists with M&A domain expertise has increased by over 60%. Establishing effective AI governance frameworks and ensuring algorithmic bias mitigation require significant investment. For due diligence, virtual data room analytics must be complemented by human-in-the-loop oversight.
  • Key technical challenges include implementing robust data validation techniques and anomaly detection algorithms for automated risk assessment. Furthermore, managing financial crime intelligence with tools for AI-based KYC verification, automated AML screening, and real-time risk screening adds another layer of complexity.

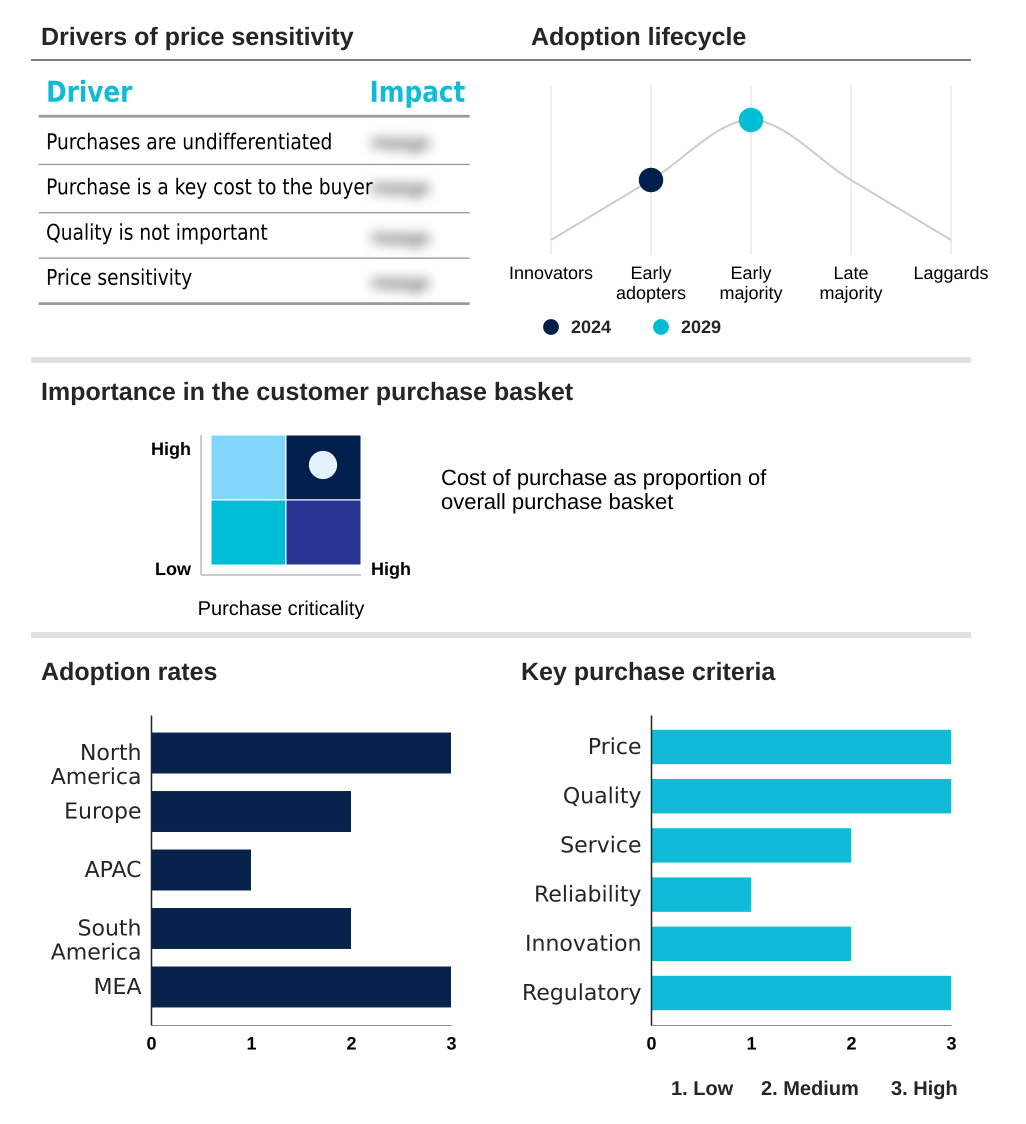
Exclusive Technavio Analysis on Customer Landscape

The ai in mergers and acquisitions market forecasting report includes the adoption lifecycle of the market, covering from the innovator’s stage to the laggard’s stage. It focuses on adoption rates in different regions based on penetration. Furthermore, the ai in mergers and acquisitions market report also includes key purchase criteria and drivers of price sensitivity to help companies evaluate and develop their market growth analysis strategies.

Customer Landscape of AI In Mergers And Acquisitions Industry

Competitive Landscape

Companies are implementing various strategies, such as strategic alliances, ai in mergers and acquisitions market forecast, partnerships, mergers and acquisitions, geographical expansion, and product/service launches, to enhance their presence in the industry.

Ansarada Group Ltd. - Offerings include AI-powered virtual data rooms and advanced workflow tools, which streamline due diligence and end-to-end M&A execution for enhanced transactional efficiency.

The industry research and growth report includes detailed analyses of the competitive landscape of the market and information about key companies, including:

  • Ansarada Group Ltd.
  • Apollo Asset Management Inc.
  • Avantis AI Inc.
  • Biteno GmbH
  • ComplyAdvantage
  • datasite LLC
  • Dealsuite
  • Digital Insight Technologies Ltd.
  • Drooms GmbH
  • Grata Inc.
  • Inven.ai
  • LexisNexis Legal and Professional
  • PitchBook Data Inc.
  • S and P Global Inc.
  • Signzy Technologies and Services Inc.
  • Slipstream Technologies Ltd.
  • Sourcescrub
  • ZoomInfo Technologies Inc.

Qualitative and quantitative analysis of companies has been conducted to help clients understand the wider business environment as well as the strengths and weaknesses of key industry players. Data is qualitatively analyzed to categorize companies as pure play, category-focused, industry-focused, and diversified; it is quantitatively analyzed to categorize companies as dominant, leading, strong, tentative, and weak.

Recent Development and News in Ai in mergers and acquisitions market

  • In June 2024, OpenAI acquired Rockset, a real-time analytics database company, to enhance its retrieval infrastructure for processing vast amounts of data for its models.
  • In May 2024, ComplyAdvantage announced a partnership with Greenlite AI to introduce AI agents to the alert management and remediation process, aiming to enhance the efficiency of financial crime compliance.
  • In April 2024, IBM completed its acquisition of HashiCorp for USD 6.4 billion to deepen its AI-powered cloud automation capabilities.
  • In March 2024, Microsoft made a strategic deal to hire most of the staff from Inflection AI and license its models, integrating the talent and technology to enhance its product offerings.

Dive into Technavio’s robust research methodology, blending expert interviews, extensive data synthesis, and validated models for unparalleled AI In Mergers And Acquisitions Market insights. See full methodology.

Market Scope
Page number 309
Base year 2024
Historic period 2019-2023
Forecast period 2025-2029
Growth momentum & CAGR Accelerate at a CAGR of 37.5%
Market growth 2025-2029 USD 2531.1 million
Market structure Fragmented
YoY growth 2024-2025(%) 30.7%
Key countries US, Canada, Mexico, Germany, UK, France, The Netherlands, Italy, Spain, China, Japan, India, Australia, South Korea, Indonesia, Brazil, Argentina, Colombia, Saudi Arabia, UAE, South Africa, Israel and Turkey
Competitive landscape Leading Companies, Market Positioning of Companies, Competitive Strategies, and Industry Risks

Request Free Sample

Research Analyst Overview

  • The AI in mergers and acquisitions market is defined by a strategic shift towards data-centric decision-making. The adoption of AI-powered due diligence and generative AI modeling is becoming standard practice, enabling firms to achieve a 40% improvement in risk detection accuracy. The use of natural language processing for automated contract review is central to this efficiency gain.
  • Deal sourcing automation and algorithmic target screening allow for more proactive strategies, supported by predictive valuation models and data-driven valuation techniques. In the post-deal phase, AI supports post-merger integration planning, real-time synergy tracking, and cultural alignment analysis. An AI-powered VDR with virtual data room analytics and automated document categorization streamlines the entire process.
  • Key applications include intellectual property analysis, AI-powered market intelligence, and predictive deal sourcing. For compliance, tools for compliance risk assessment, automated risk assessment, AI-based KYC verification, automated AML screening, financial crime intelligence, and ai-driven financial crime management are crucial. The adoption of AI-driven workflow automation and an AI-native platform intelligence is reshaping workflows.
  • Other applications include dynamic valuation modeling, operational synergy identification, IT systems integration, AI-powered background checks, and regulatory compliance navigation, making AI an indispensable asset in modern corporate finance.

What are the Key Data Covered in this AI In Mergers And Acquisitions Market Research and Growth Report?

  • What is the expected growth of the AI In Mergers And Acquisitions Market between 2025 and 2029?

    • USD 2.53 billion, at a CAGR of 37.5%

  • What segmentation does the market report cover?

    • The report is segmented by Component (Software, and Services), Deployment (Cloud-based, and On-premises), End-user (BFSI, Healthcare, Consumer and retail, Manufacturing, and Others) and Geography (North America, Europe, APAC, South America, Middle East and Africa)

  • Which regions are analyzed in the report?

    • North America, Europe, APAC, South America and Middle East and Africa

  • What are the key growth drivers and market challenges?

    • Enhanced due diligence efficiency and accuracy, Data privacy and security concerns

  • Who are the major players in the AI In Mergers And Acquisitions Market?

    • Ansarada Group Ltd., Apollo Asset Management Inc., Avantis AI Inc., Biteno GmbH, ComplyAdvantage, datasite LLC, Dealsuite, Digital Insight Technologies Ltd., Drooms GmbH, Grata Inc., Inven.ai, LexisNexis Legal and Professional, PitchBook Data Inc., S and P Global Inc., Signzy Technologies and Services Inc., Slipstream Technologies Ltd., Sourcescrub and ZoomInfo Technologies Inc.

Market Research Insights

  • The market is shaped by the need for comprehensive deal lifecycle automation, redefining the traditional mergers and acquisitions workflow. A key strategic acquisition driver is the pursuit of proprietary deal flow generation, supported by AI-powered advisory services and forecasting tools. This data-driven dealmaking approach relies on secure data room security protocols and effective data monetization strategy.
  • As a digital transformation catalyst, AI is central to legal tech integration and the automated onboarding process. Firms leverage these tools for operational excellence and advanced AI for portfolio management. The market's evolution is also marked by a focus on AI model explainability and robust algorithmic bias mitigation.
  • Enhanced data validation techniques and anomaly detection algorithms are critical, requiring human-in-the-loop oversight and strong AI governance frameworks to manage risks. These dynamics are compelling a focus on AI talent upskilling to manage this technological shift.

We can help! Our analysts can customize this ai in mergers and acquisitions market research report to meet your requirements.

Get in touch

1. Executive Summary

1.1 Market overview

Executive Summary - Chart on Market Overview
Executive Summary - Data Table on Market Overview
Executive Summary - Chart on Global Market Characteristics
Executive Summary - Chart on Market by Geography
Executive Summary - Chart on Market Segmentation by Component
Executive Summary - Chart on Market Segmentation by Deployment
Executive Summary - Chart on Market Segmentation by End-user
Executive Summary - Chart on Incremental Growth
Executive Summary - Data Table on Incremental Growth
Executive Summary - Chart on Company Market Positioning

2. Technavio Analysis

2.1 Analysis of price sensitivity, lifecycle, customer purchase basket, adoption rates, and purchase criteria

2.2 Criticality of inputs and Factors of differentiation

Chart on Overview on criticality of inputs and factors of differentiation

2.3 Factors of disruption

Chart on Overview on factors of disruption

2.4 Impact of drivers and challenges

Chart on Impact of drivers and challenges in 2024 and 2029

3. Market Landscape

3.1 Market ecosystem

Chart on Parent Market
Data Table on - Parent Market

3.2 Market characteristics

Chart on Market characteristics analysis

3.3 Value chain analysis

Chart on Value chain analysis

4. Market Sizing

4.1 Market definition

Data Table on Offerings of companies included in the market definition

4.2 Market segment analysis

Market segments

4.3 Market size 2024

4.4 Market outlook: Forecast for 2024-2029

Chart on Global - Market size and forecast 2024-2029 ($ million)
Data Table on Global - Market size and forecast 2024-2029 ($ million)
Chart on Global Market: Year-over-year growth 2024-2029 (%)
Data Table on Global Market: Year-over-year growth 2024-2029 (%)

5. Historic Market Size

5.1 Global AI In Mergers And Acquisitions Market 2019 - 2023

Historic Market Size - Data Table on Global AI In Mergers And Acquisitions Market 2019 - 2023 ($ million)

5.2 Component segment analysis 2019 - 2023

Historic Market Size - Component Segment 2019 - 2023 ($ million)

5.3 Deployment segment analysis 2019 - 2023

Historic Market Size - Deployment Segment 2019 - 2023 ($ million)

5.4 End-user segment analysis 2019 - 2023

Historic Market Size - End-user Segment 2019 - 2023 ($ million)

5.5 Geography segment analysis 2019 - 2023

Historic Market Size - Geography Segment 2019 - 2023 ($ million)

5.6 Country segment analysis 2019 - 2023

Historic Market Size - Country Segment 2019 - 2023 ($ million)

6. Five Forces Analysis

6.1 Five forces summary

Five forces analysis - Comparison between 2024 and 2029

6.2 Bargaining power of buyers

Bargaining power of buyers - Impact of key factors 2024 and 2029

6.3 Bargaining power of suppliers

Bargaining power of suppliers - Impact of key factors in 2024 and 2029

6.4 Threat of new entrants

Threat of new entrants - Impact of key factors in 2024 and 2029

6.5 Threat of substitutes

Threat of substitutes - Impact of key factors in 2024 and 2029

6.6 Threat of rivalry

Threat of rivalry - Impact of key factors in 2024 and 2029

6.7 Market condition

Chart on Market condition - Five forces 2024 and 2029

7. Market Segmentation by Component

7.1 Market segments

Chart on Component - Market share 2024-2029 (%)
Data Table on Component - Market share 2024-2029 (%)

7.2 Comparison by Component

Chart on Comparison by Component
Data Table on Comparison by Component

7.3 Software - Market size and forecast 2024-2029

Chart on Software - Market size and forecast 2024-2029 ($ million)
Data Table on Software - Market size and forecast 2024-2029 ($ million)
Chart on Software - Year-over-year growth 2024-2029 (%)
Data Table on Software - Year-over-year growth 2024-2029 (%)

7.4 Services - Market size and forecast 2024-2029

Chart on Services - Market size and forecast 2024-2029 ($ million)
Data Table on Services - Market size and forecast 2024-2029 ($ million)
Chart on Services - Year-over-year growth 2024-2029 (%)
Data Table on Services - Year-over-year growth 2024-2029 (%)

7.5 Market opportunity by Component

Market opportunity by Component ($ million)
Data Table on Market opportunity by Component ($ million)

8. Market Segmentation by Deployment

8.1 Market segments

Chart on Deployment - Market share 2024-2029 (%)
Data Table on Deployment - Market share 2024-2029 (%)

8.2 Comparison by Deployment

Chart on Comparison by Deployment
Data Table on Comparison by Deployment

8.3 Cloud-based - Market size and forecast 2024-2029

Chart on Cloud-based - Market size and forecast 2024-2029 ($ million)
Data Table on Cloud-based - Market size and forecast 2024-2029 ($ million)
Chart on Cloud-based - Year-over-year growth 2024-2029 (%)
Data Table on Cloud-based - Year-over-year growth 2024-2029 (%)

8.4 On-premises - Market size and forecast 2024-2029

Chart on On-premises - Market size and forecast 2024-2029 ($ million)
Data Table on On-premises - Market size and forecast 2024-2029 ($ million)
Chart on On-premises - Year-over-year growth 2024-2029 (%)
Data Table on On-premises - Year-over-year growth 2024-2029 (%)

8.5 Market opportunity by Deployment

Market opportunity by Deployment ($ million)
Data Table on Market opportunity by Deployment ($ million)

9. Market Segmentation by End-user

9.1 Market segments

Chart on End-user - Market share 2024-2029 (%)
Data Table on End-user - Market share 2024-2029 (%)

9.2 Comparison by End-user

Chart on Comparison by End-user
Data Table on Comparison by End-user

9.3 BFSI - Market size and forecast 2024-2029

Chart on BFSI - Market size and forecast 2024-2029 ($ million)
Data Table on BFSI - Market size and forecast 2024-2029 ($ million)
Chart on BFSI - Year-over-year growth 2024-2029 (%)
Data Table on BFSI - Year-over-year growth 2024-2029 (%)

9.4 Healthcare - Market size and forecast 2024-2029

Chart on Healthcare - Market size and forecast 2024-2029 ($ million)
Data Table on Healthcare - Market size and forecast 2024-2029 ($ million)
Chart on Healthcare - Year-over-year growth 2024-2029 (%)
Data Table on Healthcare - Year-over-year growth 2024-2029 (%)

9.5 Consumer and retail - Market size and forecast 2024-2029

Chart on Consumer and retail - Market size and forecast 2024-2029 ($ million)
Data Table on Consumer and retail - Market size and forecast 2024-2029 ($ million)
Chart on Consumer and retail - Year-over-year growth 2024-2029 (%)
Data Table on Consumer and retail - Year-over-year growth 2024-2029 (%)

9.6 Manufacturing - Market size and forecast 2024-2029

Chart on Manufacturing - Market size and forecast 2024-2029 ($ million)
Data Table on Manufacturing - Market size and forecast 2024-2029 ($ million)
Chart on Manufacturing - Year-over-year growth 2024-2029 (%)
Data Table on Manufacturing - Year-over-year growth 2024-2029 (%)

9.7 Others - Market size and forecast 2024-2029

Chart on Others - Market size and forecast 2024-2029 ($ million)
Data Table on Others - Market size and forecast 2024-2029 ($ million)
Chart on Others - Year-over-year growth 2024-2029 (%)
Data Table on Others - Year-over-year growth 2024-2029 (%)

9.8 Market opportunity by End-user

Market opportunity by End-user ($ million)
Data Table on Market opportunity by End-user ($ million)

10. Customer Landscape

10.1 Customer landscape overview

Analysis of price sensitivity, lifecycle, customer purchase basket, adoption rates, and purchase criteria

11. Geographic Landscape

11.1 Geographic segmentation

Chart on Market share by geography 2024-2029 (%)
Data Table on Market share by geography 2024-2029 (%)

11.2 Geographic comparison

Chart on Geographic comparison
Data Table on Geographic comparison

11.3 North America - Market size and forecast 2024-2029

Chart on North America - Market size and forecast 2024-2029 ($ million)
Data Table on North America - Market size and forecast 2024-2029 ($ million)
Chart on North America - Year-over-year growth 2024-2029 (%)
Data Table on North America - Year-over-year growth 2024-2029 (%)
Chart on Regional Comparison - North America
Data Table on Regional Comparison - North America

11.3.1 US - Market size and forecast 2024-2029

Chart on US - Market size and forecast 2024-2029 ($ million)
Data Table on US - Market size and forecast 2024-2029 ($ million)
Chart on US - Year-over-year growth 2024-2029 (%)
Data Table on US - Year-over-year growth 2024-2029 (%)

11.3.2 Canada - Market size and forecast 2024-2029

Chart on Canada - Market size and forecast 2024-2029 ($ million)
Data Table on Canada - Market size and forecast 2024-2029 ($ million)
Chart on Canada - Year-over-year growth 2024-2029 (%)
Data Table on Canada - Year-over-year growth 2024-2029 (%)

11.3.3 Mexico - Market size and forecast 2024-2029

Chart on Mexico - Market size and forecast 2024-2029 ($ million)
Data Table on Mexico - Market size and forecast 2024-2029 ($ million)
Chart on Mexico - Year-over-year growth 2024-2029 (%)
Data Table on Mexico - Year-over-year growth 2024-2029 (%)

11.4 Europe - Market size and forecast 2024-2029

Chart on Europe - Market size and forecast 2024-2029 ($ million)
Data Table on Europe - Market size and forecast 2024-2029 ($ million)
Chart on Europe - Year-over-year growth 2024-2029 (%)
Data Table on Europe - Year-over-year growth 2024-2029 (%)
Chart on Regional Comparison - Europe
Data Table on Regional Comparison - Europe

11.4.1 Germany - Market size and forecast 2024-2029

Chart on Germany - Market size and forecast 2024-2029 ($ million)
Data Table on Germany - Market size and forecast 2024-2029 ($ million)
Chart on Germany - Year-over-year growth 2024-2029 (%)
Data Table on Germany - Year-over-year growth 2024-2029 (%)

11.4.2 UK - Market size and forecast 2024-2029

Chart on UK - Market size and forecast 2024-2029 ($ million)
Data Table on UK - Market size and forecast 2024-2029 ($ million)
Chart on UK - Year-over-year growth 2024-2029 (%)
Data Table on UK - Year-over-year growth 2024-2029 (%)

11.4.3 France - Market size and forecast 2024-2029

Chart on France - Market size and forecast 2024-2029 ($ million)
Data Table on France - Market size and forecast 2024-2029 ($ million)
Chart on France - Year-over-year growth 2024-2029 (%)
Data Table on France - Year-over-year growth 2024-2029 (%)

11.4.4 The Netherlands - Market size and forecast 2024-2029

Chart on The Netherlands - Market size and forecast 2024-2029 ($ million)
Data Table on The Netherlands - Market size and forecast 2024-2029 ($ million)
Chart on The Netherlands - Year-over-year growth 2024-2029 (%)
Data Table on The Netherlands - Year-over-year growth 2024-2029 (%)

11.4.5 Italy - Market size and forecast 2024-2029

Chart on Italy - Market size and forecast 2024-2029 ($ million)
Data Table on Italy - Market size and forecast 2024-2029 ($ million)
Chart on Italy - Year-over-year growth 2024-2029 (%)
Data Table on Italy - Year-over-year growth 2024-2029 (%)

11.4.6 Spain - Market size and forecast 2024-2029

Chart on Spain - Market size and forecast 2024-2029 ($ million)
Data Table on Spain - Market size and forecast 2024-2029 ($ million)
Chart on Spain - Year-over-year growth 2024-2029 (%)
Data Table on Spain - Year-over-year growth 2024-2029 (%)

11.5 APAC - Market size and forecast 2024-2029

Chart on APAC - Market size and forecast 2024-2029 ($ million)
Data Table on APAC - Market size and forecast 2024-2029 ($ million)
Chart on APAC - Year-over-year growth 2024-2029 (%)
Data Table on APAC - Year-over-year growth 2024-2029 (%)
Chart on Regional Comparison - APAC
Data Table on Regional Comparison - APAC

11.5.1 China - Market size and forecast 2024-2029

Chart on China - Market size and forecast 2024-2029 ($ million)
Data Table on China - Market size and forecast 2024-2029 ($ million)
Chart on China - Year-over-year growth 2024-2029 (%)
Data Table on China - Year-over-year growth 2024-2029 (%)

11.5.2 Japan - Market size and forecast 2024-2029

Chart on Japan - Market size and forecast 2024-2029 ($ million)
Data Table on Japan - Market size and forecast 2024-2029 ($ million)
Chart on Japan - Year-over-year growth 2024-2029 (%)
Data Table on Japan - Year-over-year growth 2024-2029 (%)

11.5.3 India - Market size and forecast 2024-2029

Chart on India - Market size and forecast 2024-2029 ($ million)
Data Table on India - Market size and forecast 2024-2029 ($ million)
Chart on India - Year-over-year growth 2024-2029 (%)
Data Table on India - Year-over-year growth 2024-2029 (%)

11.5.4 Australia - Market size and forecast 2024-2029

Chart on Australia - Market size and forecast 2024-2029 ($ million)
Data Table on Australia - Market size and forecast 2024-2029 ($ million)
Chart on Australia - Year-over-year growth 2024-2029 (%)
Data Table on Australia - Year-over-year growth 2024-2029 (%)

11.5.5 South Korea - Market size and forecast 2024-2029

Chart on South Korea - Market size and forecast 2024-2029 ($ million)
Data Table on South Korea - Market size and forecast 2024-2029 ($ million)
Chart on South Korea - Year-over-year growth 2024-2029 (%)
Data Table on South Korea - Year-over-year growth 2024-2029 (%)

11.5.6 Indonesia - Market size and forecast 2024-2029

Chart on Indonesia - Market size and forecast 2024-2029 ($ million)
Data Table on Indonesia - Market size and forecast 2024-2029 ($ million)
Chart on Indonesia - Year-over-year growth 2024-2029 (%)
Data Table on Indonesia - Year-over-year growth 2024-2029 (%)

11.6 South America - Market size and forecast 2024-2029

Chart on South America - Market size and forecast 2024-2029 ($ million)
Data Table on South America - Market size and forecast 2024-2029 ($ million)
Chart on South America - Year-over-year growth 2024-2029 (%)
Data Table on South America - Year-over-year growth 2024-2029 (%)
Chart on Regional Comparison - South America
Data Table on Regional Comparison - South America

11.6.1 Brazil - Market size and forecast 2024-2029

Chart on Brazil - Market size and forecast 2024-2029 ($ million)
Data Table on Brazil - Market size and forecast 2024-2029 ($ million)
Chart on Brazil - Year-over-year growth 2024-2029 (%)
Data Table on Brazil - Year-over-year growth 2024-2029 (%)

11.6.2 Argentina - Market size and forecast 2024-2029

Chart on Argentina - Market size and forecast 2024-2029 ($ million)
Data Table on Argentina - Market size and forecast 2024-2029 ($ million)
Chart on Argentina - Year-over-year growth 2024-2029 (%)
Data Table on Argentina - Year-over-year growth 2024-2029 (%)

11.6.3 Colombia - Market size and forecast 2024-2029

Chart on Colombia - Market size and forecast 2024-2029 ($ million)
Data Table on Colombia - Market size and forecast 2024-2029 ($ million)
Chart on Colombia - Year-over-year growth 2024-2029 (%)
Data Table on Colombia - Year-over-year growth 2024-2029 (%)

11.7 Middle East and Africa - Market size and forecast 2024-2029

Chart on Middle East and Africa - Market size and forecast 2024-2029 ($ million)
Data Table on Middle East and Africa - Market size and forecast 2024-2029 ($ million)
Chart on Middle East and Africa - Year-over-year growth 2024-2029 (%)
Data Table on Middle East and Africa - Year-over-year growth 2024-2029 (%)
Chart on Regional Comparison - Middle East and Africa
Data Table on Regional Comparison - Middle East and Africa

11.7.1 Saudi Arabia - Market size and forecast 2024-2029

Chart on Saudi Arabia - Market size and forecast 2024-2029 ($ million)
Data Table on Saudi Arabia - Market size and forecast 2024-2029 ($ million)
Chart on Saudi Arabia - Year-over-year growth 2024-2029 (%)
Data Table on Saudi Arabia - Year-over-year growth 2024-2029 (%)

11.7.2 UAE - Market size and forecast 2024-2029

Chart on UAE - Market size and forecast 2024-2029 ($ million)
Data Table on UAE - Market size and forecast 2024-2029 ($ million)
Chart on UAE - Year-over-year growth 2024-2029 (%)
Data Table on UAE - Year-over-year growth 2024-2029 (%)

11.7.3 South Africa - Market size and forecast 2024-2029

Chart on South Africa - Market size and forecast 2024-2029 ($ million)
Data Table on South Africa - Market size and forecast 2024-2029 ($ million)
Chart on South Africa - Year-over-year growth 2024-2029 (%)
Data Table on South Africa - Year-over-year growth 2024-2029 (%)

11.7.4 Israel - Market size and forecast 2024-2029

Chart on Israel - Market size and forecast 2024-2029 ($ million)
Data Table on Israel - Market size and forecast 2024-2029 ($ million)
Chart on Israel - Year-over-year growth 2024-2029 (%)
Data Table on Israel - Year-over-year growth 2024-2029 (%)

11.7.5 Turkey - Market size and forecast 2024-2029

Chart on Turkey - Market size and forecast 2024-2029 ($ million)
Data Table on Turkey - Market size and forecast 2024-2029 ($ million)
Chart on Turkey - Year-over-year growth 2024-2029 (%)
Data Table on Turkey - Year-over-year growth 2024-2029 (%)

11.8 Market opportunity by geography

Market opportunity by geography ($ million)
Data Tables on Market opportunity by geography ($ million)

12. Drivers, Challenges, and Opportunity

12.1 Market drivers

Enhanced due diligence efficiency and accuracy
Improved target identification and valuation
Streamlined post-merger integration

12.2 Market challenges

Data privacy and security concerns
Complexity and cost of implementation
Talent gap and need for specialized expertise

12.3 Impact of drivers and challenges

Impact of drivers and challenges in 2024 and 2029

12.4 Market opportunities

Ascendancy of generative AI in mergers and acquisitions processes
AI-powered predictive analytics for enhanced deal sourcing and valuation
Focus on AI for strategic post-merger integration and synergy realization

13. Competitive Landscape

13.1 Overview

13.2

Overview on criticality of inputs and factors of differentiation

13.3 Landscape disruption

Overview on factors of disruption

13.4 Industry risks

Impact of key risks on business

14. Competitive Analysis

14.1 Companies profiled

Companies covered

14.2 Company ranking index

14.3 Market positioning of companies

Matrix on companies position and classification

14.4 Ansarada Group Ltd.

Ansarada Group Ltd. - Overview
Ansarada Group Ltd. - Product / Service
Ansarada Group Ltd. - Key offerings
SWOT

14.5 Apollo Asset Management Inc.

Apollo Asset Management Inc. - Overview
Apollo Asset Management Inc. - Business segments
Apollo Asset Management Inc. - Key offerings
Apollo Asset Management Inc. - Segment focus
SWOT

14.6 Avantis AI Inc.

Avantis AI Inc. - Overview
Avantis AI Inc. - Product / Service
Avantis AI Inc. - Key offerings
SWOT

14.7 Biteno GmbH

Biteno GmbH - Overview
Biteno GmbH - Product / Service
Biteno GmbH - Key offerings
SWOT

14.8 ComplyAdvantage

ComplyAdvantage - Overview
ComplyAdvantage - Product / Service
ComplyAdvantage - Key offerings
SWOT

14.9 datasite LLC

datasite LLC - Overview
datasite LLC - Product / Service
datasite LLC - Key offerings
SWOT

14.10 Dealsuite

Dealsuite - Overview
Dealsuite - Product / Service
Dealsuite - Key offerings
SWOT

14.11 Digital Insight Technologies Ltd.

Digital Insight Technologies Ltd. - Overview
Digital Insight Technologies Ltd. - Product / Service
Digital Insight Technologies Ltd. - Key offerings
SWOT

14.12 Drooms GmbH

Drooms GmbH - Overview
Drooms GmbH - Product / Service
Drooms GmbH - Key offerings
SWOT

14.13 Grata Inc.

Grata Inc. - Overview
Grata Inc. - Product / Service
Grata Inc. - Key offerings
SWOT

14.14 Inven.ai

Inven.ai - Overview
Inven.ai - Product / Service
Inven.ai - Key offerings
SWOT

14.15 LexisNexis Legal and Professional

LexisNexis Legal and Professional - Overview
LexisNexis Legal and Professional - Product / Service
LexisNexis Legal and Professional - Key offerings
SWOT

14.16 Signzy Technologies and Services Inc.

Signzy Technologies and Services Inc. - Overview
Signzy Technologies and Services Inc. - Product / Service
Signzy Technologies and Services Inc. - Key offerings
SWOT

14.17 Slipstream Technologies Ltd.

Slipstream Technologies Ltd. - Overview
Slipstream Technologies Ltd. - Product / Service
Slipstream Technologies Ltd. - Key offerings
SWOT

14.18 Sourcescrub

Sourcescrub - Overview
Sourcescrub - Product / Service
Sourcescrub - Key offerings
SWOT

15. Appendix

15.1 Scope of the report

Market definition
Objectives
Notes and caveats

15.2 Inclusions and exclusions checklist

Inclusions checklist
Exclusions checklist

15.3 Currency conversion rates for US$

15.4 Research methodology

15.5 Data procurement

Information sources

15.6 Data validation

15.7 Validation techniques employed for market sizing

15.8 Data synthesis

15.9 360 degree market analysis

15.10 List of abbreviations

Research Methodology

Technavio presents a detailed picture of the market by way of study, synthesis, and summation of data from multiple sources. The analysts have presented the various facets of the market with a particular focus on identifying the key industry influencers. The data thus presented is comprehensive, reliable, and the result of extensive research, both primary and secondary.

INFORMATION SOURCES

Primary sources

  • Manufacturers and suppliers
  • Channel partners
  • Industry experts
  • Strategic decision makers

Secondary sources

  • Industry journals and periodicals
  • Government data
  • Financial reports of key industry players
  • Historical data
  • Press releases

DATA ANALYSIS

Data Synthesis

  • Collation of data
  • Estimation of key figures
  • Analysis of derived insights

Data Validation

  • Triangulation with data models
  • Reference against proprietary databases
  • Corroboration with industry experts

REPORT WRITING

Qualitative

  • Market drivers
  • Market challenges
  • Market trends
  • Five forces analysis

Quantitative

  • Market size and forecast
  • Market segmentation
  • Geographical insights
  • Competitive landscape

Interested in this report?

Get your sample now to see our research methodology and insights!

Download Now

Frequently Asked Questions

AI In Mergers And Acquisitions market growth will increase by USD 2531.1 million during 2025-2029.

The AI In Mergers And Acquisitions market is expected to grow at a CAGR of 37.5% during 2025-2029.

AI In Mergers And Acquisitions market is segmented by Component (Software, Services) Deployment (Cloud-based, On-premises) End-user (BFSI, Healthcare, Consumer and retail, Manufacturing, Others)

Ansarada Group Ltd., Apollo Asset Management Inc., Avantis AI Inc., Biteno GmbH, ComplyAdvantage, datasite LLC, Dealsuite, Digital Insight Technologies Ltd., Drooms GmbH, Grata Inc., Inven.ai, LexisNexis Legal and Professional, PitchBook Data Inc., S and P Global Inc., Signzy Technologies and Services Inc., Slipstream Technologies Ltd., Sourcescrub, ZoomInfo Technologies Inc. are a few of the key vendors in the AI In Mergers And Acquisitions market.

North America will register the highest growth rate of 37.3% among the other regions. Therefore, the AI In Mergers And Acquisitions market in North America is expected to garner significant business opportunities for the vendors during the forecast period.

US, Canada, Mexico, Germany, UK, France, The Netherlands, Italy, Spain, China, Japan, India, Australia, South Korea, Indonesia, Brazil, Argentina, Colombia, Saudi Arabia, UAE, South Africa, Israel, Turkey

  • Enhanced due diligence efficiency and accuracy is the driving factor this market.

The AI In Mergers And Acquisitions market vendors should focus on grabbing business opportunities from the Component segment as it accounted for the largest market share in the base year.