AI In Healthcare Technologies Market Analysis, Size, and Forecast 2025-2029: North America (US, Canada, and Mexico), Europe (Germany, UK, and France), APAC (China, Japan, and India), Middle East and Africa (Saudi Arabia, UAE, and Israel), South America (Brazil, Argentina, and Colombia), and Rest of World (ROW)

AI In Healthcare Technologies Market Analysis, Size, and Forecast 2025-2029:
North America (US, Canada, and Mexico), Europe (Germany, UK, and France), APAC (China, Japan, and India), Middle East and Africa (Saudi Arabia, UAE, and Israel), South America (Brazil, Argentina, and Colombia), and Rest of World (ROW)

Published: Dec 2025 311 Pages SKU: IRTNTR81053

Market Overview at a Glance

$57.81 B
Market Opportunity
32.6%
CAGR 2024 - 2029
41.4%
North America Growth
$7.18 B
Software segment 2023

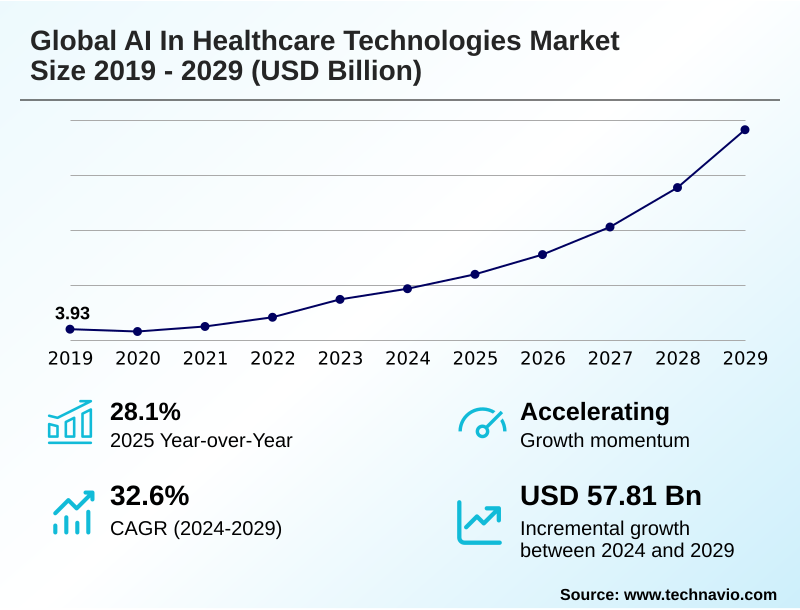
AI In Healthcare Technologies Market Size 2025-2029

The ai in healthcare technologies market size is valued to increase by USD 57.81 billion, at a CAGR of 32.6% from 2024 to 2029. Increasing adoption of AI for enhanced diagnostics and personalized treatment will drive the ai in healthcare technologies market.

Major Market Trends & Insights

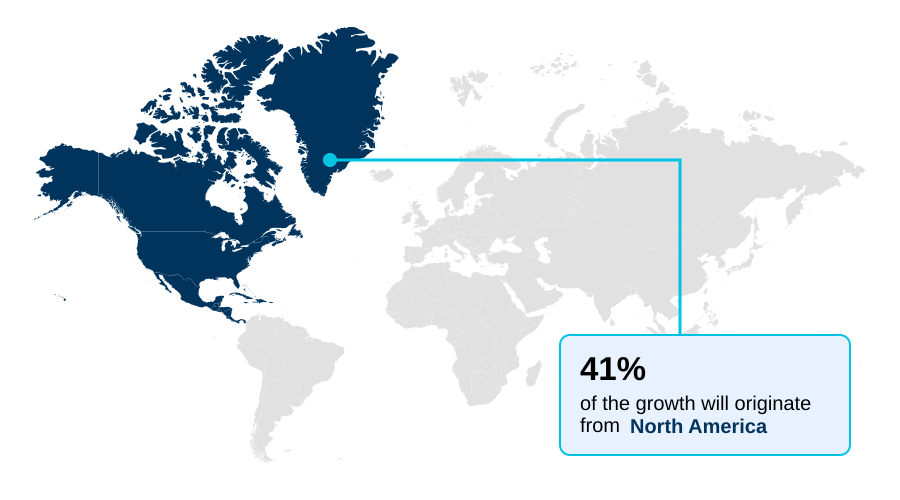
  • North America dominated the market and accounted for a 41.4% growth during the forecast period.
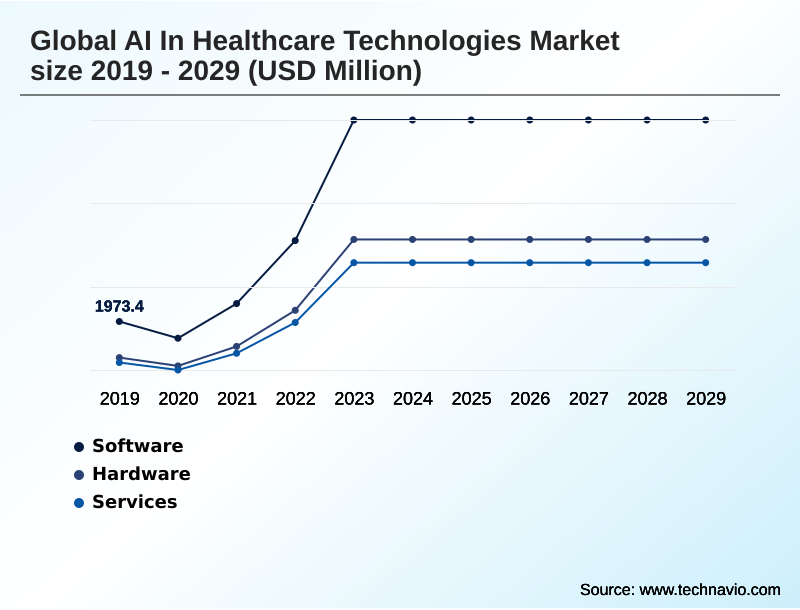
  • By Component - Software segment was valued at USD 7.18 billion in 2023
  • By Technology - Machine learning segment accounted for the largest market revenue share in 2023

Market Size & Forecast

  • Market Opportunities: USD 72.53 billion
  • Market Future Opportunities: USD 57.81 billion
  • CAGR from 2024 to 2029 : 32.6%

Market Summary

  • The AI in healthcare technologies market is characterized by the rapid integration of advanced computational systems into clinical and operational workflows. These technologies are pivotal for enhancing diagnostic precision, personalizing patient treatment, and streamlining healthcare delivery. Key drivers include the exponential growth of complex medical data and the persistent need for cost containment and improved efficiency within healthcare systems.
  • A significant trend is the shift toward proactive and predictive care, where algorithms analyze patient data to forecast health risks and enable early interventions. For instance, a hospital can leverage AI to predict patient admission surges, allowing for optimized staff scheduling and resource allocation, thereby reducing wait times and improving care quality.
  • However, the industry faces challenges related to data privacy, the interoperability of disparate IT systems, and the need for clear regulatory frameworks. The development of explainable and ethical AI is also a critical focus, ensuring that these powerful tools are transparent, fair, and trustworthy for both clinicians and patients as they become more embedded in critical healthcare decisions.

What will be the Size of the AI In Healthcare Technologies Market during the forecast period?

Get Key Insights on Market Forecast (PDF) Request Free Sample

How is the AI In Healthcare Technologies Market Segmented?

The ai in healthcare technologies industry research report provides comprehensive data (region-wise segment analysis), with forecasts and estimates in "USD million" for the period 2025-2029, as well as historical data from 2019-2023 for the following segments.

  • Component
    • Software
    • Hardware
    • Services
  • Technology
    • Machine learning
    • Computer vision
    • NLP
    • Predictive analytics
    • Robotics and expert systems
  • Application
    • Medical imaging and diagnostics
    • Drug discovery and development
    • Precision medicine and genomics
    • Others
  • Geography
    • North America
      • US
      • Canada
      • Mexico
    • Europe
      • Germany
      • UK
      • France
    • APAC
      • China
      • Japan
      • India
    • Middle East and Africa
      • Saudi Arabia
      • UAE
      • Israel
    • South America
      • Brazil
      • Argentina
      • Colombia
    • Rest of World (ROW)

By Component Insights

The software segment is estimated to witness significant growth during the forecast period.

The software segment is central to the AI in healthcare technologies market, encompassing the computational systems and algorithms that drive intelligent automation and analysis.

These platforms, which include advanced tools for clinical workflow automation and patient risk stratification, are critical for modernizing healthcare delivery. Offerings range from enterprise-level solutions integrated within hospital networks to specialized applications for individual clinical tasks.

For example, the use of AI has been shown to reduce errors in administrative tasks like medical coding by over 15%, freeing up resources for patient care.

The emphasis is on creating secure, interoperable software that can process de-identified patient data for model training while adhering to strict cybersecurity protocols, enabling functionalities like smart insulin delivery and advanced diagnostic support with tools such as the AI-Rad companion and AI sight dx pathology, ultimately leveraging IoHT and cognitive automation.

Request Free Sample

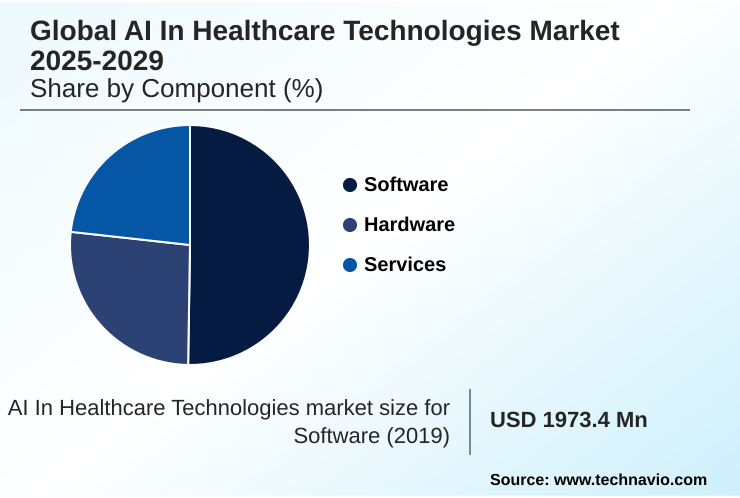
The Software segment was valued at USD 7.18 billion in 2023 and showed a gradual increase during the forecast period.

Request Free Sample

Regional Analysis

North America is estimated to contribute 41.4% to the growth of the global market during the forecast period.Technavio’s analysts have elaborately explained the regional trends and drivers that shape the market during the forecast period.

See How AI In Healthcare Technologies Market Demand is Rising in North America Request Free Sample

The geographic landscape of the AI in healthcare technologies market is led by North America, which accounts for over 41% of incremental growth, driven by high investment in robotic-assisted surgery and advanced R&D.

Hospitals in the region report that using natural language processing (NLP) to analyze clinical notes has improved administrative efficiency by over 20%.

Europe is a strong secondary market, with a focus on ethical AI and mitigating algorithmic bias, particularly in publicly funded health systems.

The region is advancing the use of large language models (LLMs) for clinical documentation and integrating AI-enhanced imaging into radiology information systems.

The APAC region is the fastest-growing market, characterized by government-led digital health initiatives and a focus on deploying AI to improve healthcare access in underserved areas.

Key applications include biomarker identification and automated medical coding to streamline hospital operations and supply chain optimization.

Market Dynamics

Our researchers analyzed the data with 2024 as the base year, along with the key drivers, trends, and challenges. A holistic analysis of drivers will help companies refine their marketing strategies to gain a competitive advantage.

  • The strategic implementation of AI is reshaping healthcare, with a primary focus on improving clinical outcomes and operational workflows. The use of AI for early cancer detection is becoming a clinical standard, leveraging computer vision in medical imaging to identify malignancies with greater precision than manual review alone.
  • This diagnostic improvement is complemented by the growth of AI-driven personalized treatment plans, which analyze genomic and clinical data to tailor therapies. In pharmaceuticals, machine learning in drug discovery is significantly shortening development timelines, a shift that is mirrored in clinical settings where AI integration with EHR systems provides real-time decision support.
  • As these systems become more complex, the demand for explainable AI models in radiology is increasing to ensure clinician trust and adoption. Concurrently, developing robust ethical frameworks for healthcare AI is paramount to address concerns around bias and patient privacy.
  • The focus on improving hospital operational efficiency with AI is critical, as facilities implementing AI for optimizing healthcare supply chains see inventory waste reduction at rates more than double those using traditional methods. This efficiency extends to using predictive analytics for patient readmission, which helps providers allocate resources more effectively.
  • Furthermore, NLP for unstructured clinical notes unlocks valuable data, while robotic-assisted minimally invasive surgery enhances surgical precision. The ecosystem is supported by AI platforms for precision medicine that utilize genomic data analysis using AI. This is all happening while navigating cybersecurity for healthcare AI systems and interoperability challenges for AI in healthcare.
  • The deployment of virtual health assistants for patient engagement and remote patient monitoring with AI is also expanding, alongside tools for AI for clinical trial patient matching, pushing the entire industry toward a more connected, data-driven future.

What are the key market drivers leading to the rise in the adoption of AI In Healthcare Technologies Industry?

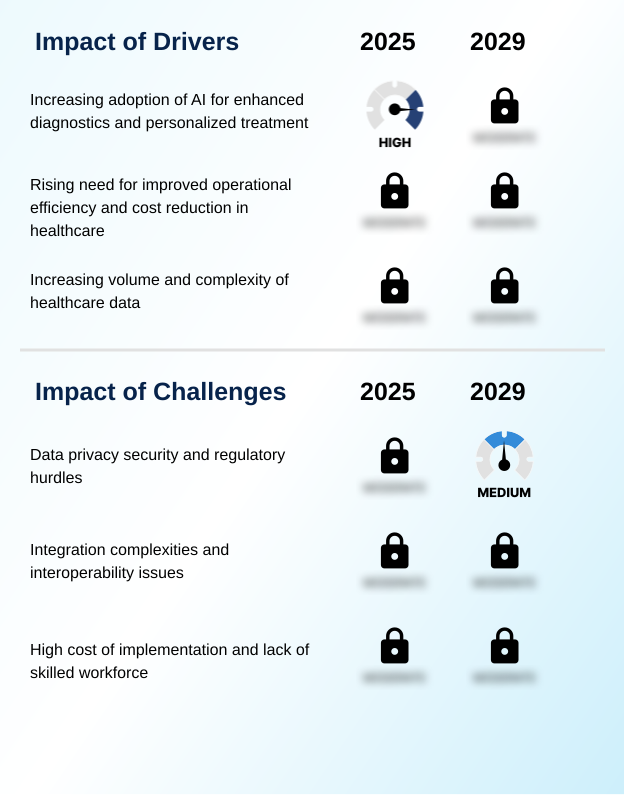
  • The increasing adoption of artificial intelligence for enhanced diagnostics and personalized treatment is a primary driver fueling market growth.

  • The growth of the AI in healthcare technologies market is primarily fueled by the convergence of advanced technologies and pressing clinical needs.
  • The increasing adoption of machine learning and deep learning algorithms for enhanced diagnostics is a major driver, with computer vision in medical imaging analysis reducing diagnostic errors by up to 20% in complex cases.
  • This demand is amplified by the sheer volume of healthcare data, which requires sophisticated predictive analytics for genomic data processing and clinical decision support. Another key driver is the push for greater operational efficiency and personalized treatment.
  • Healthcare systems are deploying AI for intelligent hospital logistics and predictive patient flow, which can improve resource allocation by 15%.
  • This drive for efficiency and improved outcomes underpins the strategic investment in AI technologies across the healthcare landscape, fostering innovations in population health management.

What are the market trends shaping the AI In Healthcare Technologies Industry?

  • The growing emphasis on explainable AI and the establishment of robust ethical frameworks represent a pivotal trend shaping the market. This reflects an increasing demand for transparency, fairness, and accountability in clinical decision-making.

  • Key trends are reshaping the AI in healthcare technologies market, pushing it toward more transparent and patient-centric models. The emphasis on explainable AI (XAI) and ethical AI frameworks is growing, as providers seek to build trust and ensure accountability.
  • Platforms incorporating XAI have seen clinician adoption rates increase by over 25%, as transparency in algorithmic reasoning is critical for clinical buy-in. Concurrently, the shift to proactive healthcare is accelerating, driven by AI-powered diagnostic tools capable of early disease detection.
  • This trend is enhanced by the seamless telemedicine integration with digital health platforms, which are leveraging virtual health assistants to improve patient engagement. This integration has improved triage efficiency by over 30% in some systems. Further innovation in AI-driven precision medicine is being seen in digital pathology and pharmacogenomics, enabling a holistic patient view for highly personalized interventions.

What challenges does the AI In Healthcare Technologies Industry face during its growth?

  • Data privacy, security concerns, and complex regulatory hurdles present a significant challenge to the widespread adoption and scaling of AI technologies in healthcare.

  • Despite its potential, the AI in healthcare technologies market faces significant adoption hurdles. The primary challenge is ensuring data privacy and security while adhering to complex regulatory compliance, which can increase initial project costs by up to 30%.
  • A critical technical barrier is the lack of interoperability standards, making legacy IT system integration a time-consuming and expensive process that can delay deployments by several months. This fragmentation hinders the effective use of AI-integrated EHR systems and advanced AI-driven healthcare analytics.
  • Furthermore, a persistent shortage of skilled workforce development creates bottlenecks in both developing and deploying sophisticated solutions like federated learning models and AI microservices. Overcoming these clinical workflow disruption and integration challenges requires a concerted effort to standardize protocols and invest in interdisciplinary talent.

Exclusive Technavio Analysis on Customer Landscape

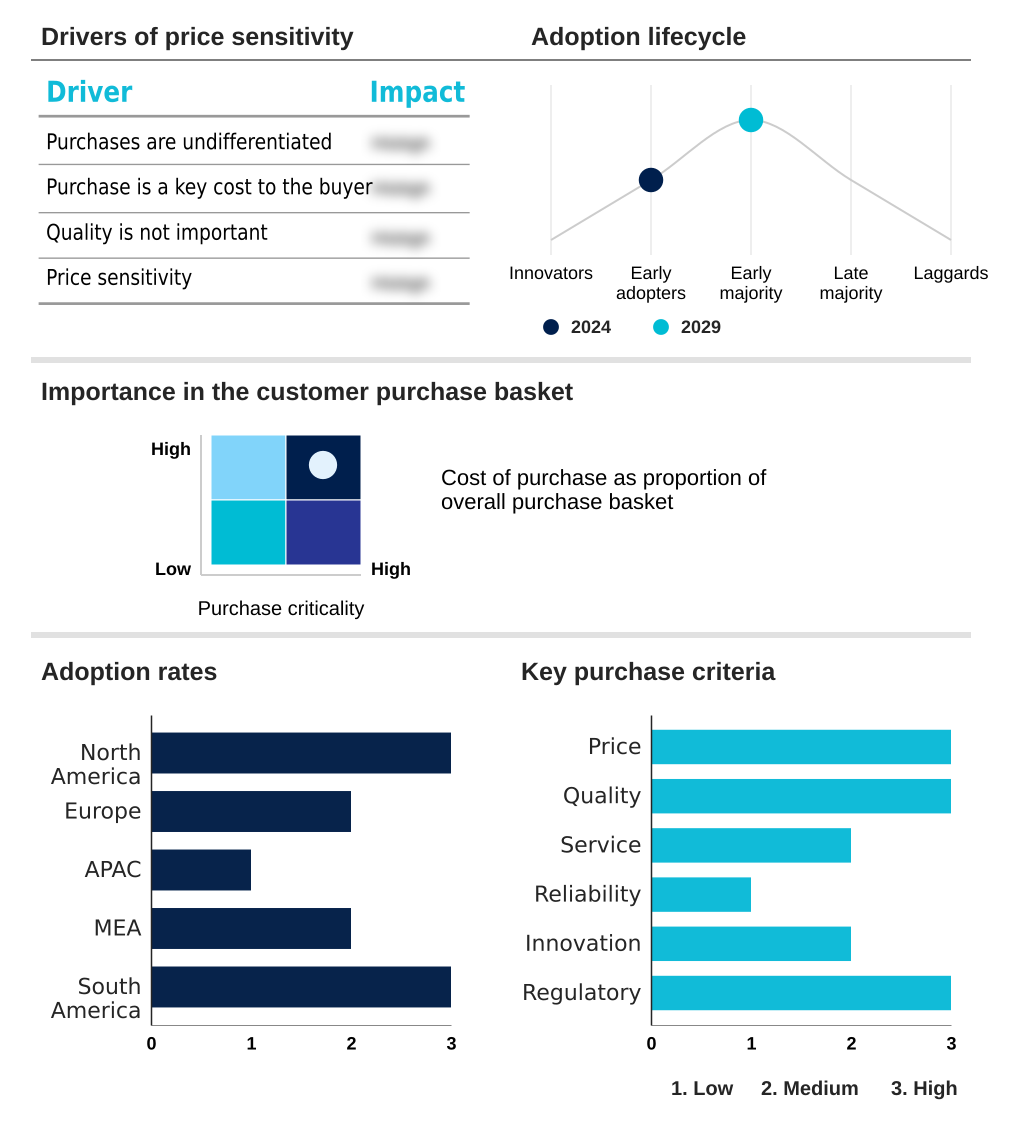
The ai in healthcare technologies market forecasting report includes the adoption lifecycle of the market, covering from the innovator’s stage to the laggard’s stage. It focuses on adoption rates in different regions based on penetration. Furthermore, the ai in healthcare technologies market report also includes key purchase criteria and drivers of price sensitivity to help companies evaluate and develop their market growth analysis strategies.

Customer Landscape of AI In Healthcare Technologies Industry

Competitive Landscape

Companies are implementing various strategies, such as strategic alliances, ai in healthcare technologies market forecast, partnerships, mergers and acquisitions, geographical expansion, and product/service launches, to enhance their presence in the industry.

Ada Health GmbH - The company offers AI in healthcare technologies, such as AI-powered radiology tools for real-time detection, integrated with hospital systems for faster diagnostics and enhanced patient treatment.

The industry research and growth report includes detailed analyses of the competitive landscape of the market and information about key companies, including:

  • Ada Health GmbH
  • Aidoc Medical Ltd.
  • AliveCor Inc.
  • Butterfly Network Inc.
  • Epic Systems Corp.
  • Freenome Holdings Inc.
  • GE Healthcare Technologies
  • Google LLC
  • IBM Corp.
  • Intuitive Surgical Inc.
  • Koninklijke Philips NV
  • Medtronic Plc
  • Merative L.P.
  • Microsoft Corp.
  • NVIDIA Corp.
  • Oracle Corp.
  • PathAI Inc.
  • Siemens AG
  • Teladoc Health Inc.
  • Tempus Labs Inc.
  • Viz.ai Inc.

Qualitative and quantitative analysis of companies has been conducted to help clients understand the wider business environment as well as the strengths and weaknesses of key industry players. Data is qualitatively analyzed to categorize companies as pure play, category-focused, industry-focused, and diversified; it is quantitatively analyzed to categorize companies as dominant, leading, strong, tentative, and weak.

Recent Development and News in Ai in healthcare technologies market

  • In September 2024, PharmaCorp announced a strategic partnership with AI specialist GenSyn to leverage machine learning algorithms for accelerating the identification of potential drug candidates and optimizing clinical trial design.
  • In November 2024, Summit Health System implemented an AI-powered clinical decision support system across its network, demonstrating a significant improvement in diagnostic accuracy for complex diseases and reducing patient readmission rates.
  • In January 2025, Precision Genomics launched its new AI platform that analyzes patient genomic data, EHRs, and lifestyle factors to create tailored treatment plans for chronic diseases and oncology.
  • In March 2025, ClearAI Analytics released its new explainable AI (XAI) model for medical imaging, designed to increase transparency and trust by showing clinicians the specific features used in diagnostic recommendations.

Dive into Technavio’s robust research methodology, blending expert interviews, extensive data synthesis, and validated models for unparalleled AI In Healthcare Technologies Market insights. See full methodology.

Market Scope
Page number 311
Base year 2024
Historic period 2019-2023
Forecast period 2025-2029
Growth momentum & CAGR Accelerate at a CAGR of 32.6%
Market growth 2025-2029 USD 57806.0 million
Market structure Fragmented
YoY growth 2024-2025(%) 28.1%
Key countries US, Canada, Mexico, Germany, UK, France, Italy, Spain, The Netherlands, China, Japan, India, South Korea, Australia, Indonesia, Saudi Arabia, UAE, Israel, South Africa, Turkey, Brazil, Argentina and Colombia
Competitive landscape Leading Companies, Market Positioning of Companies, Competitive Strategies, and Industry Risks

Request Free Sample

Research Analyst Overview

  • The AI in healthcare technologies market is evolving from a niche segment into a foundational pillar of modern medical infrastructure. This transition is driven by the maturation of core technologies like deep learning algorithms for medical imaging analysis and genomic data processing, which are now integral to clinical decision support.
  • The adoption of AI-powered diagnostic tools and digital pathology platforms is becoming widespread, enabling a level of precision and speed previously unattainable; for example, some AI-driven workflows have demonstrated an ability to accelerate pathology slide analysis by over 40%.
  • For the boardroom, the rise of explainable AI (XAI) is a critical development, directly addressing governance and regulatory compliance by making algorithmic decision-making transparent. As organizations invest in high-performance computing and AI-integrated EHR systems, the focus shifts to leveraging federated learning models, AI-driven healthcare analytics, and AI microservices.
  • This landscape, encompassing everything from robotic-assisted surgery and pharmacogenomics to virtual health assistants, underscores a strategic imperative for healthcare providers to invest in these transformational software as a medical device (SaMD) solutions to remain competitive.

What are the Key Data Covered in this AI In Healthcare Technologies Market Research and Growth Report?

  • What is the expected growth of the AI In Healthcare Technologies Market between 2025 and 2029?

    • USD 57.81 billion, at a CAGR of 32.6%

  • What segmentation does the market report cover?

    • The report is segmented by Component (Software, Hardware, Services), Technology (Machine learning, Computer vision, NLP, Predictive analytics, Robotics and expert systems), Application (Medical imaging and diagnostics, Drug discovery and development, Precision medicine and genomics, Others) and Geography (North America, Europe, APAC, Middle East and Africa, South America)

  • Which regions are analyzed in the report?

    • North America, Europe, APAC, Middle East and Africa and South America

  • What are the key growth drivers and market challenges?

    • Increasing adoption of AI for enhanced diagnostics and personalized treatment, Data privacy security and regulatory hurdles

  • Who are the major players in the AI In Healthcare Technologies Market?

    • Ada Health GmbH, Aidoc Medical Ltd., AliveCor Inc., Butterfly Network Inc., Epic Systems Corp., Freenome Holdings Inc., GE Healthcare Technologies, Google LLC, IBM Corp., Intuitive Surgical Inc., Koninklijke Philips NV, Medtronic Plc, Merative L.P., Microsoft Corp., NVIDIA Corp., Oracle Corp., PathAI Inc., Siemens AG, Teladoc Health Inc., Tempus Labs Inc. and Viz.ai Inc.

Market Research Insights

  • The AI in healthcare technologies market is defined by a dynamic interplay of innovation and practical application, driving a shift toward proactive healthcare and greater operational efficiency. The adoption of these technologies is accelerating, with some integrated platforms demonstrating the ability to improve diagnostic accuracy by over 15%.
  • This progress is supported by ethical AI frameworks designed to build trust and ensure fairness. A key focus is achieving seamless interoperability standards to connect disparate systems, a move that can reduce integration costs by up to 20%.
  • As organizations prioritize skilled workforce development, the implementation of AI for tasks like clinical trial matching and population health management becomes more effective, promising a more connected and intelligent healthcare ecosystem. This evolution underscores a strategic move from reactive treatment to predictive and personalized health management.

We can help! Our analysts can customize this ai in healthcare technologies market research report to meet your requirements.

Get in touch

1. Executive Summary

1.1 Market overview

Executive Summary - Chart on Market Overview
Executive Summary - Data Table on Market Overview
Executive Summary - Chart on Global Market Characteristics
Executive Summary - Chart on Market by Geography
Executive Summary - Chart on Market Segmentation by Component
Executive Summary - Chart on Market Segmentation by Technology
Executive Summary - Chart on Market Segmentation by Application
Executive Summary - Chart on Incremental Growth
Executive Summary - Data Table on Incremental Growth
Executive Summary - Chart on Company Market Positioning

2. Technavio Analysis

2.1 Analysis of price sensitivity, lifecycle, customer purchase basket, adoption rates, and purchase criteria

2.2 Criticality of inputs and Factors of differentiation

Chart on Overview on criticality of inputs and factors of differentiation

2.3 Factors of disruption

Chart on Overview on factors of disruption

2.4 Impact of drivers and challenges

Chart on Impact of drivers and challenges in 2024 and 2029

3. Market Landscape

3.1 Market ecosystem

Chart on Parent Market
Data Table on - Parent Market

3.2 Market characteristics

Chart on Market characteristics analysis

3.3 Value chain analysis

Chart on Value chain analysis

4. Market Sizing

4.1 Market definition

Data Table on Offerings of companies included in the market definition

4.2 Market segment analysis

Market segments

4.3 Market size 2024

4.4 Market outlook: Forecast for 2024-2029

Chart on Global - Market size and forecast 2024-2029 ($ million)
Data Table on Global - Market size and forecast 2024-2029 ($ million)
Chart on Global Market: Year-over-year growth 2024-2029 (%)
Data Table on Global Market: Year-over-year growth 2024-2029 (%)

5. Historic Market Size

5.1 Global AI In Healthcare Technologies Market 2019 - 2023

Historic Market Size - Data Table on Global AI In Healthcare Technologies Market 2019 - 2023 ($ million)

5.2 Component segment analysis 2019 - 2023

Historic Market Size - Component Segment 2019 - 2023 ($ million)

5.3 Technology segment analysis 2019 - 2023

Historic Market Size - Technology Segment 2019 - 2023 ($ million)

5.4 Application segment analysis 2019 - 2023

Historic Market Size - Application Segment 2019 - 2023 ($ million)

5.5 Geography segment analysis 2019 - 2023

Historic Market Size - Geography Segment 2019 - 2023 ($ million)

5.6 Country segment analysis 2019 - 2023

Historic Market Size - Country Segment 2019 - 2023 ($ million)

6. Five Forces Analysis

6.1 Five forces summary

Five forces analysis - Comparison between 2024 and 2029

6.2 Bargaining power of buyers

Bargaining power of buyers - Impact of key factors 2024 and 2029

6.3 Bargaining power of suppliers

Bargaining power of suppliers - Impact of key factors in 2024 and 2029

6.4 Threat of new entrants

Threat of new entrants - Impact of key factors in 2024 and 2029

6.5 Threat of substitutes

Threat of substitutes - Impact of key factors in 2024 and 2029

6.6 Threat of rivalry

Threat of rivalry - Impact of key factors in 2024 and 2029

6.7 Market condition

Chart on Market condition - Five forces 2024 and 2029

7. Market Segmentation by Component

7.1 Market segments

Chart on Component - Market share 2024-2029 (%)
Data Table on Component - Market share 2024-2029 (%)

7.2 Comparison by Component

Chart on Comparison by Component
Data Table on Comparison by Component

7.3 Software - Market size and forecast 2024-2029

Chart on Software - Market size and forecast 2024-2029 ($ million)
Data Table on Software - Market size and forecast 2024-2029 ($ million)
Chart on Software - Year-over-year growth 2024-2029 (%)
Data Table on Software - Year-over-year growth 2024-2029 (%)

7.4 Hardware - Market size and forecast 2024-2029

Chart on Hardware - Market size and forecast 2024-2029 ($ million)
Data Table on Hardware - Market size and forecast 2024-2029 ($ million)
Chart on Hardware - Year-over-year growth 2024-2029 (%)
Data Table on Hardware - Year-over-year growth 2024-2029 (%)

7.5 Services - Market size and forecast 2024-2029

Chart on Services - Market size and forecast 2024-2029 ($ million)
Data Table on Services - Market size and forecast 2024-2029 ($ million)
Chart on Services - Year-over-year growth 2024-2029 (%)
Data Table on Services - Year-over-year growth 2024-2029 (%)

7.6 Market opportunity by Component

Market opportunity by Component ($ million)
Data Table on Market opportunity by Component ($ million)

8. Market Segmentation by Technology

8.1 Market segments

Chart on Technology - Market share 2024-2029 (%)
Data Table on Technology - Market share 2024-2029 (%)

8.2 Comparison by Technology

Chart on Comparison by Technology
Data Table on Comparison by Technology

8.3 Machine learning - Market size and forecast 2024-2029

Chart on Machine learning - Market size and forecast 2024-2029 ($ million)
Data Table on Machine learning - Market size and forecast 2024-2029 ($ million)
Chart on Machine learning - Year-over-year growth 2024-2029 (%)
Data Table on Machine learning - Year-over-year growth 2024-2029 (%)

8.4 Computer vision - Market size and forecast 2024-2029

Chart on Computer vision - Market size and forecast 2024-2029 ($ million)
Data Table on Computer vision - Market size and forecast 2024-2029 ($ million)
Chart on Computer vision - Year-over-year growth 2024-2029 (%)
Data Table on Computer vision - Year-over-year growth 2024-2029 (%)

8.5 NLP - Market size and forecast 2024-2029

Chart on NLP - Market size and forecast 2024-2029 ($ million)
Data Table on NLP - Market size and forecast 2024-2029 ($ million)
Chart on NLP - Year-over-year growth 2024-2029 (%)
Data Table on NLP - Year-over-year growth 2024-2029 (%)

8.6 Predictive analytics - Market size and forecast 2024-2029

Chart on Predictive analytics - Market size and forecast 2024-2029 ($ million)
Data Table on Predictive analytics - Market size and forecast 2024-2029 ($ million)
Chart on Predictive analytics - Year-over-year growth 2024-2029 (%)
Data Table on Predictive analytics - Year-over-year growth 2024-2029 (%)

8.7 Robotics and expert systems - Market size and forecast 2024-2029

Chart on Robotics and expert systems - Market size and forecast 2024-2029 ($ million)
Data Table on Robotics and expert systems - Market size and forecast 2024-2029 ($ million)
Chart on Robotics and expert systems - Year-over-year growth 2024-2029 (%)
Data Table on Robotics and expert systems - Year-over-year growth 2024-2029 (%)

8.8 Market opportunity by Technology

Market opportunity by Technology ($ million)
Data Table on Market opportunity by Technology ($ million)

9. Market Segmentation by Application

9.1 Market segments

Chart on Application - Market share 2024-2029 (%)
Data Table on Application - Market share 2024-2029 (%)

9.2 Comparison by Application

Chart on Comparison by Application
Data Table on Comparison by Application

9.3 Medical imaging and diagnostics - Market size and forecast 2024-2029

Chart on Medical imaging and diagnostics - Market size and forecast 2024-2029 ($ million)
Data Table on Medical imaging and diagnostics - Market size and forecast 2024-2029 ($ million)
Chart on Medical imaging and diagnostics - Year-over-year growth 2024-2029 (%)
Data Table on Medical imaging and diagnostics - Year-over-year growth 2024-2029 (%)

9.4 Drug discovery and development - Market size and forecast 2024-2029

Chart on Drug discovery and development - Market size and forecast 2024-2029 ($ million)
Data Table on Drug discovery and development - Market size and forecast 2024-2029 ($ million)
Chart on Drug discovery and development - Year-over-year growth 2024-2029 (%)
Data Table on Drug discovery and development - Year-over-year growth 2024-2029 (%)

9.5 Precision medicine and genomics - Market size and forecast 2024-2029

Chart on Precision medicine and genomics - Market size and forecast 2024-2029 ($ million)
Data Table on Precision medicine and genomics - Market size and forecast 2024-2029 ($ million)
Chart on Precision medicine and genomics - Year-over-year growth 2024-2029 (%)
Data Table on Precision medicine and genomics - Year-over-year growth 2024-2029 (%)

9.6 Others - Market size and forecast 2024-2029

Chart on Others - Market size and forecast 2024-2029 ($ million)
Data Table on Others - Market size and forecast 2024-2029 ($ million)
Chart on Others - Year-over-year growth 2024-2029 (%)
Data Table on Others - Year-over-year growth 2024-2029 (%)

9.7 Market opportunity by Application

Market opportunity by Application ($ million)
Data Table on Market opportunity by Application ($ million)

10. Customer Landscape

10.1 Customer landscape overview

Analysis of price sensitivity, lifecycle, customer purchase basket, adoption rates, and purchase criteria

11. Geographic Landscape

11.1 Geographic segmentation

Chart on Market share by geography 2024-2029 (%)
Data Table on Market share by geography 2024-2029 (%)

11.2 Geographic comparison

Chart on Geographic comparison
Data Table on Geographic comparison

11.3 North America - Market size and forecast 2024-2029

Chart on North America - Market size and forecast 2024-2029 ($ million)
Data Table on North America - Market size and forecast 2024-2029 ($ million)
Chart on North America - Year-over-year growth 2024-2029 (%)
Data Table on North America - Year-over-year growth 2024-2029 (%)
Chart on Regional Comparison - North America
Data Table on Regional Comparison - North America

11.3.1 US - Market size and forecast 2024-2029

Chart on US - Market size and forecast 2024-2029 ($ million)
Data Table on US - Market size and forecast 2024-2029 ($ million)
Chart on US - Year-over-year growth 2024-2029 (%)
Data Table on US - Year-over-year growth 2024-2029 (%)

11.3.2 Canada - Market size and forecast 2024-2029

Chart on Canada - Market size and forecast 2024-2029 ($ million)
Data Table on Canada - Market size and forecast 2024-2029 ($ million)
Chart on Canada - Year-over-year growth 2024-2029 (%)
Data Table on Canada - Year-over-year growth 2024-2029 (%)

11.3.3 Mexico - Market size and forecast 2024-2029

Chart on Mexico - Market size and forecast 2024-2029 ($ million)
Data Table on Mexico - Market size and forecast 2024-2029 ($ million)
Chart on Mexico - Year-over-year growth 2024-2029 (%)
Data Table on Mexico - Year-over-year growth 2024-2029 (%)

11.4 Europe - Market size and forecast 2024-2029

Chart on Europe - Market size and forecast 2024-2029 ($ million)
Data Table on Europe - Market size and forecast 2024-2029 ($ million)
Chart on Europe - Year-over-year growth 2024-2029 (%)
Data Table on Europe - Year-over-year growth 2024-2029 (%)
Chart on Regional Comparison - Europe
Data Table on Regional Comparison - Europe

11.4.1 Germany - Market size and forecast 2024-2029

Chart on Germany - Market size and forecast 2024-2029 ($ million)
Data Table on Germany - Market size and forecast 2024-2029 ($ million)
Chart on Germany - Year-over-year growth 2024-2029 (%)
Data Table on Germany - Year-over-year growth 2024-2029 (%)

11.4.2 UK - Market size and forecast 2024-2029

Chart on UK - Market size and forecast 2024-2029 ($ million)
Data Table on UK - Market size and forecast 2024-2029 ($ million)
Chart on UK - Year-over-year growth 2024-2029 (%)
Data Table on UK - Year-over-year growth 2024-2029 (%)

11.4.3 France - Market size and forecast 2024-2029

Chart on France - Market size and forecast 2024-2029 ($ million)
Data Table on France - Market size and forecast 2024-2029 ($ million)
Chart on France - Year-over-year growth 2024-2029 (%)
Data Table on France - Year-over-year growth 2024-2029 (%)

11.4.4 Italy - Market size and forecast 2024-2029

Chart on Italy - Market size and forecast 2024-2029 ($ million)
Data Table on Italy - Market size and forecast 2024-2029 ($ million)
Chart on Italy - Year-over-year growth 2024-2029 (%)
Data Table on Italy - Year-over-year growth 2024-2029 (%)

11.4.5 Spain - Market size and forecast 2024-2029

Chart on Spain - Market size and forecast 2024-2029 ($ million)
Data Table on Spain - Market size and forecast 2024-2029 ($ million)
Chart on Spain - Year-over-year growth 2024-2029 (%)
Data Table on Spain - Year-over-year growth 2024-2029 (%)

11.4.6 The Netherlands - Market size and forecast 2024-2029

Chart on The Netherlands - Market size and forecast 2024-2029 ($ million)
Data Table on The Netherlands - Market size and forecast 2024-2029 ($ million)
Chart on The Netherlands - Year-over-year growth 2024-2029 (%)
Data Table on The Netherlands - Year-over-year growth 2024-2029 (%)

11.5 APAC - Market size and forecast 2024-2029

Chart on APAC - Market size and forecast 2024-2029 ($ million)
Data Table on APAC - Market size and forecast 2024-2029 ($ million)
Chart on APAC - Year-over-year growth 2024-2029 (%)
Data Table on APAC - Year-over-year growth 2024-2029 (%)
Chart on Regional Comparison - APAC
Data Table on Regional Comparison - APAC

11.5.1 China - Market size and forecast 2024-2029

Chart on China - Market size and forecast 2024-2029 ($ million)
Data Table on China - Market size and forecast 2024-2029 ($ million)
Chart on China - Year-over-year growth 2024-2029 (%)
Data Table on China - Year-over-year growth 2024-2029 (%)

11.5.2 Japan - Market size and forecast 2024-2029

Chart on Japan - Market size and forecast 2024-2029 ($ million)
Data Table on Japan - Market size and forecast 2024-2029 ($ million)
Chart on Japan - Year-over-year growth 2024-2029 (%)
Data Table on Japan - Year-over-year growth 2024-2029 (%)

11.5.3 India - Market size and forecast 2024-2029

Chart on India - Market size and forecast 2024-2029 ($ million)
Data Table on India - Market size and forecast 2024-2029 ($ million)
Chart on India - Year-over-year growth 2024-2029 (%)
Data Table on India - Year-over-year growth 2024-2029 (%)

11.5.4 South Korea - Market size and forecast 2024-2029

Chart on South Korea - Market size and forecast 2024-2029 ($ million)
Data Table on South Korea - Market size and forecast 2024-2029 ($ million)
Chart on South Korea - Year-over-year growth 2024-2029 (%)
Data Table on South Korea - Year-over-year growth 2024-2029 (%)

11.5.5 Australia - Market size and forecast 2024-2029

Chart on Australia - Market size and forecast 2024-2029 ($ million)
Data Table on Australia - Market size and forecast 2024-2029 ($ million)
Chart on Australia - Year-over-year growth 2024-2029 (%)
Data Table on Australia - Year-over-year growth 2024-2029 (%)

11.5.6 Indonesia - Market size and forecast 2024-2029

Chart on Indonesia - Market size and forecast 2024-2029 ($ million)
Data Table on Indonesia - Market size and forecast 2024-2029 ($ million)
Chart on Indonesia - Year-over-year growth 2024-2029 (%)
Data Table on Indonesia - Year-over-year growth 2024-2029 (%)

11.6 Middle East and Africa - Market size and forecast 2024-2029

Chart on Middle East and Africa - Market size and forecast 2024-2029 ($ million)
Data Table on Middle East and Africa - Market size and forecast 2024-2029 ($ million)
Chart on Middle East and Africa - Year-over-year growth 2024-2029 (%)
Data Table on Middle East and Africa - Year-over-year growth 2024-2029 (%)
Chart on Regional Comparison - Middle East and Africa
Data Table on Regional Comparison - Middle East and Africa

11.6.1 Saudi Arabia - Market size and forecast 2024-2029

Chart on Saudi Arabia - Market size and forecast 2024-2029 ($ million)
Data Table on Saudi Arabia - Market size and forecast 2024-2029 ($ million)
Chart on Saudi Arabia - Year-over-year growth 2024-2029 (%)
Data Table on Saudi Arabia - Year-over-year growth 2024-2029 (%)

11.6.2 UAE - Market size and forecast 2024-2029

Chart on UAE - Market size and forecast 2024-2029 ($ million)
Data Table on UAE - Market size and forecast 2024-2029 ($ million)
Chart on UAE - Year-over-year growth 2024-2029 (%)
Data Table on UAE - Year-over-year growth 2024-2029 (%)

11.6.3 Israel - Market size and forecast 2024-2029

Chart on Israel - Market size and forecast 2024-2029 ($ million)
Data Table on Israel - Market size and forecast 2024-2029 ($ million)
Chart on Israel - Year-over-year growth 2024-2029 (%)
Data Table on Israel - Year-over-year growth 2024-2029 (%)

11.6.4 South Africa - Market size and forecast 2024-2029

Chart on South Africa - Market size and forecast 2024-2029 ($ million)
Data Table on South Africa - Market size and forecast 2024-2029 ($ million)
Chart on South Africa - Year-over-year growth 2024-2029 (%)
Data Table on South Africa - Year-over-year growth 2024-2029 (%)

11.6.5 Turkey - Market size and forecast 2024-2029

Chart on Turkey - Market size and forecast 2024-2029 ($ million)
Data Table on Turkey - Market size and forecast 2024-2029 ($ million)
Chart on Turkey - Year-over-year growth 2024-2029 (%)
Data Table on Turkey - Year-over-year growth 2024-2029 (%)

11.7 South America - Market size and forecast 2024-2029

Chart on South America - Market size and forecast 2024-2029 ($ million)
Data Table on South America - Market size and forecast 2024-2029 ($ million)
Chart on South America - Year-over-year growth 2024-2029 (%)
Data Table on South America - Year-over-year growth 2024-2029 (%)
Chart on Regional Comparison - South America
Data Table on Regional Comparison - South America

11.7.1 Brazil - Market size and forecast 2024-2029

Chart on Brazil - Market size and forecast 2024-2029 ($ million)
Data Table on Brazil - Market size and forecast 2024-2029 ($ million)
Chart on Brazil - Year-over-year growth 2024-2029 (%)
Data Table on Brazil - Year-over-year growth 2024-2029 (%)

11.7.2 Argentina - Market size and forecast 2024-2029

Chart on Argentina - Market size and forecast 2024-2029 ($ million)
Data Table on Argentina - Market size and forecast 2024-2029 ($ million)
Chart on Argentina - Year-over-year growth 2024-2029 (%)
Data Table on Argentina - Year-over-year growth 2024-2029 (%)

11.7.3 Colombia - Market size and forecast 2024-2029

Chart on Colombia - Market size and forecast 2024-2029 ($ million)
Data Table on Colombia - Market size and forecast 2024-2029 ($ million)
Chart on Colombia - Year-over-year growth 2024-2029 (%)
Data Table on Colombia - Year-over-year growth 2024-2029 (%)

11.8 Market opportunity by geography

Market opportunity by geography ($ million)
Data Tables on Market opportunity by geography ($ million)

12. Drivers, Challenges, and Opportunity

12.1 Market drivers

Increasing adoption of AI for enhanced diagnostics and personalized treatment
Rising need for improved operational efficiency and cost reduction in healthcare
Increasing volume and complexity of healthcare data

12.2 Market challenges

Data privacy security and regulatory hurdles
Integration complexities and interoperability issues
High cost of implementation and lack of skilled workforce

12.3 Impact of drivers and challenges

Impact of drivers and challenges in 2024 and 2029

12.4 Market opportunities

Explainable AI and ethical AI frameworks
Personalized and predictive AI for proactive healthcare
Integration of AI with digital health platforms and telemedicine

13. Competitive Landscape

13.1 Overview

13.2

Overview on criticality of inputs and factors of differentiation

13.3 Landscape disruption

Overview on factors of disruption

13.4 Industry risks

Impact of key risks on business

14. Competitive Analysis

14.1 Companies profiled

Companies covered

14.2 Company ranking index

14.3 Market positioning of companies

Matrix on companies position and classification

14.4 Aidoc Medical Ltd.

Aidoc Medical Ltd. - Overview
Aidoc Medical Ltd. - Product / Service
Aidoc Medical Ltd. - Key offerings
SWOT

14.5 Epic Systems Corp.

Epic Systems Corp. - Overview
Epic Systems Corp. - Product / Service
Epic Systems Corp. - Key offerings
SWOT

14.6 GE Healthcare Technologies

GE Healthcare Technologies - Overview
GE Healthcare Technologies - Business segments
GE Healthcare Technologies - Key news
GE Healthcare Technologies - Key offerings
GE Healthcare Technologies - Segment focus
SWOT

14.7 Google LLC

Google LLC - Overview
Google LLC - Product / Service
Google LLC - Key offerings
SWOT

14.8 Intuitive Surgical Inc.

Intuitive Surgical Inc. - Overview
Intuitive Surgical Inc. - Product / Service
Intuitive Surgical Inc. - Key offerings
SWOT

14.9 Koninklijke Philips NV

Koninklijke Philips NV - Overview
Koninklijke Philips NV - Business segments
Koninklijke Philips NV - Key news
Koninklijke Philips NV - Key offerings
Koninklijke Philips NV - Segment focus
SWOT

14.10 Medtronic Plc

Medtronic Plc - Overview
Medtronic Plc - Business segments
Medtronic Plc - Key news
Medtronic Plc - Key offerings
Medtronic Plc - Segment focus
SWOT

14.11 Merative L.P.

Merative L.P. - Overview
Merative L.P. - Product / Service
Merative L.P. - Key offerings
SWOT

14.12 Microsoft Corp.

Microsoft Corp. - Overview
Microsoft Corp. - Business segments
Microsoft Corp. - Key news
Microsoft Corp. - Key offerings
Microsoft Corp. - Segment focus
SWOT

14.13 NVIDIA Corp.

NVIDIA Corp. - Overview
NVIDIA Corp. - Business segments
NVIDIA Corp. - Key news
NVIDIA Corp. - Key offerings
NVIDIA Corp. - Segment focus
SWOT

14.14 Oracle Corp.

Oracle Corp. - Overview
Oracle Corp. - Business segments
Oracle Corp. - Key news
Oracle Corp. - Key offerings
Oracle Corp. - Segment focus
SWOT

14.15 PathAI Inc.

PathAI Inc. - Overview
PathAI Inc. - Product / Service
PathAI Inc. - Key offerings
SWOT

14.16 Siemens AG

Siemens AG - Overview
Siemens AG - Business segments
Siemens AG - Key news
Siemens AG - Key offerings
Siemens AG - Segment focus
SWOT

14.17 Teladoc Health Inc.

Teladoc Health Inc. - Overview
Teladoc Health Inc. - Product / Service
Teladoc Health Inc. - Key offerings
SWOT

14.18 Tempus Labs Inc.

Tempus Labs Inc. - Overview
Tempus Labs Inc. - Product / Service
Tempus Labs Inc. - Key offerings
SWOT

15. Appendix

15.1 Scope of the report

Market definition
Objectives
Notes and caveats

15.2 Inclusions and exclusions checklist

Inclusions checklist
Exclusions checklist

15.3 Currency conversion rates for US$

15.4 Research methodology

15.5 Data procurement

Information sources

15.6 Data validation

15.7 Validation techniques employed for market sizing

15.8 Data synthesis

15.9 360 degree market analysis

15.10 List of abbreviations

Research Methodology

Technavio presents a detailed picture of the market by way of study, synthesis, and summation of data from multiple sources. The analysts have presented the various facets of the market with a particular focus on identifying the key industry influencers. The data thus presented is comprehensive, reliable, and the result of extensive research, both primary and secondary.

INFORMATION SOURCES

Primary sources

  • Manufacturers and suppliers
  • Channel partners
  • Industry experts
  • Strategic decision makers

Secondary sources

  • Industry journals and periodicals
  • Government data
  • Financial reports of key industry players
  • Historical data
  • Press releases

DATA ANALYSIS

Data Synthesis

  • Collation of data
  • Estimation of key figures
  • Analysis of derived insights

Data Validation

  • Triangulation with data models
  • Reference against proprietary databases
  • Corroboration with industry experts

REPORT WRITING

Qualitative

  • Market drivers
  • Market challenges
  • Market trends
  • Five forces analysis

Quantitative

  • Market size and forecast
  • Market segmentation
  • Geographical insights
  • Competitive landscape

Interested in this report?

Get your sample now to see our research methodology and insights!

Download Now

Frequently Asked Questions

AI In Healthcare Technologies market growth will increase by USD 57806.0 million during 2025-2029.

The AI In Healthcare Technologies market is expected to grow at a CAGR of 32.6% during 2025-2029.

AI In Healthcare Technologies market is segmented by Component (Software, Hardware, Services) Technology (Machine learning, Computer vision, NLP, Predictive analytics, Robotics and expert systems) Application (Medical imaging and diagnostics, Drug discovery and development, Precision medicine and genomics, Others)

Ada Health GmbH, Aidoc Medical Ltd., AliveCor Inc., Butterfly Network Inc., Epic Systems Corp., Freenome Holdings Inc., GE Healthcare Technologies, Google LLC, IBM Corp., Intuitive Surgical Inc., Koninklijke Philips NV, Medtronic Plc, Merative L.P., Microsoft Corp., NVIDIA Corp., Oracle Corp., PathAI Inc., Siemens AG, Teladoc Health Inc., Tempus Labs Inc., Viz.ai Inc. are a few of the key vendors in the AI In Healthcare Technologies market.

North America will register the highest growth rate of 41.4% among the other regions. Therefore, the AI In Healthcare Technologies market in North America is expected to garner significant business opportunities for the vendors during the forecast period.

US, Canada, Mexico, Germany, UK, France, Italy, Spain, The Netherlands, China, Japan, India, South Korea, Australia, Indonesia, Saudi Arabia, UAE, Israel, South Africa, Turkey, Brazil, Argentina, Colombia

  • Increasing adoption of AI for enhanced diagnostics and personalized treatment is the driving factor this market.

The AI In Healthcare Technologies market vendors should focus on grabbing business opportunities from the Component segment as it accounted for the largest market share in the base year.