AI In ESG And Sustainability Market Analysis, Size, and Forecast 2025-2029: North America (US), Europe (France, Germany, and UK), APAC (Australia, China, India, Japan, and South Korea), South America (Brazil), and Rest of World (ROW)

AI In ESG And Sustainability Market Analysis, Size, and Forecast 2025-2029:
North America (US), Europe (France, Germany, and UK), APAC (Australia, China, India, Japan, and South Korea), South America (Brazil), and Rest of World (ROW)

Published: Aug 2025 247 Pages SKU: IRTNTR80973

Market Overview at a Glance

$3.47 B
Market Opportunity
29.3%
CAGR
24.4
YoY growth 2024-2025(%)

AI In ESG And Sustainability Market Size 2025-2029

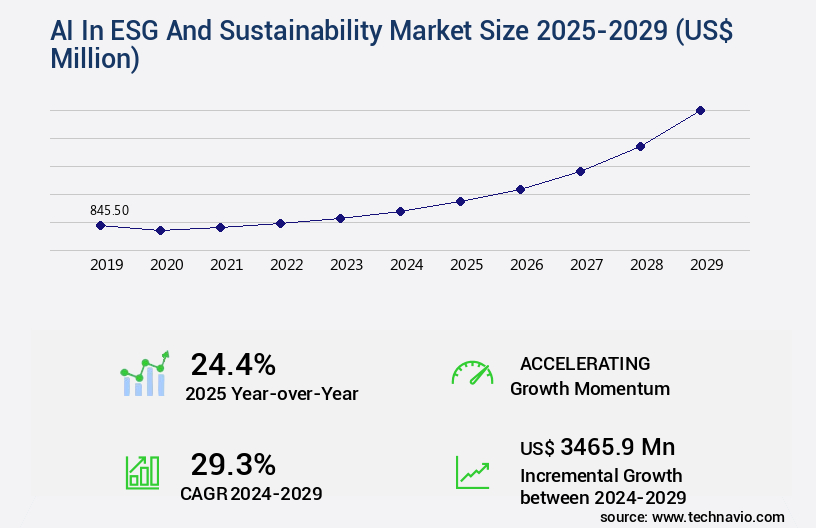
The ai in esg and sustainability market size is valued to increase by USD 3.47 billion, at a CAGR of 29.3% from 2024 to 2029. Intensifying regulatory scrutiny and mandatory disclosure frameworks will drive the ai in esg and sustainability market.

Major Market Trends & Insights

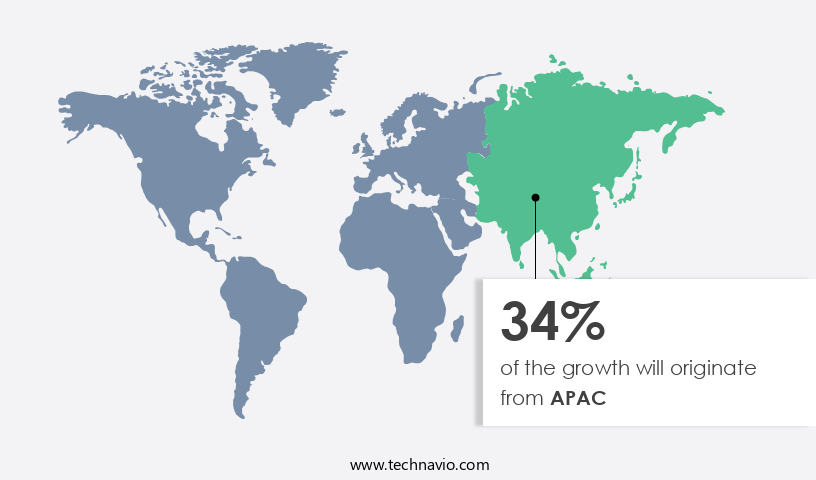
  • APAC dominated the market and accounted for a 34% growth during the forecast period.
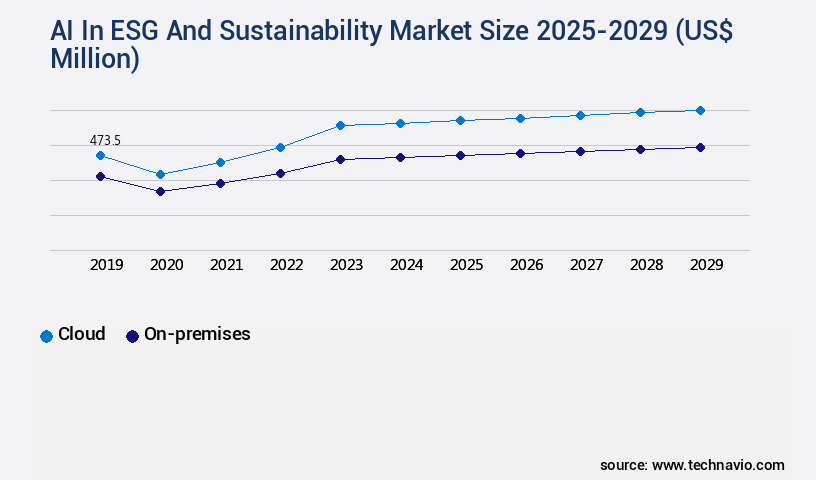
  • By Deployment - Cloud segment was valued at USD 473.50 billion in 2023
  • By End-user - Building and construction segment accounted for the largest market revenue share in 2023

Market Size & Forecast

  • Market Opportunities: USD 466.61 million
  • Market Future Opportunities: USD 3465.90 million
  • CAGR from 2024 to 2029 : 29.3%

Market Summary

  • In the realm of Environmental, Social, and Governance (ESG) and sustainability initiatives, Artificial Intelligence (AI) is increasingly becoming a game-changer. According to recent estimates, The market is projected to reach USD12.6 billion by 2027, growing at a steady pace. This expansion is fueled by intensifying regulatory scrutiny and mandatory disclosure frameworks that necessitate more efficient and accurate ESG data management. Hyper-automation of ESG data collection, assurance, and reporting is another significant driver. AI algorithms can process vast amounts of data from various sources, identify patterns, and generate insights, enabling organizations to make informed decisions and demonstrate transparency.
  • However, the pervasive issue of data quality, accessibility, and standardization poses a challenge. AI systems require high-quality, reliable data to function effectively, and ensuring this data's accuracy and accessibility remains a complex task. As AI continues to evolve, it will likely address these challenges by improving data quality through advanced data cleansing techniques and enhancing accessibility through cloud-based platforms. Moreover, AI will contribute to the standardization of ESG data by providing a common language and framework for understanding and comparing data across organizations. In the future, AI's role in ESG and sustainability will expand beyond data management to include predictive analytics, risk assessment, and continuous improvement strategies.
  • This will enable businesses to not only meet regulatory requirements but also enhance their overall sustainability performance and reputation.

What will be the Size of the AI In ESG And Sustainability Market during the forecast period?

AI In ESG And Sustainability Market Size

Get Key Insights on Market Forecast (PDF) Request Free Sample

How is the AI In ESG And Sustainability Market Segmented ?

The ai in esg and sustainability industry research report provides comprehensive data (region-wise segment analysis), with forecasts and estimates in "USD million" for the period 2025-2029, as well as historical data from 2019-2023 for the following segments.

  • Deployment
    • Cloud
    • On-premises
  • End-user
    • Building and construction
    • Oil and gas
    • Agriculture
    • Food and beverage
    • Others
  • Technology
    • Machine learning
    • Generative AI
    • Deep learning
    • Natural language processing (NLP)
    • Predictive analysis
  • Geography
    • North America
      • US
    • Europe
      • France
      • Germany
      • UK
    • APAC
      • Australia
      • China
      • India
      • Japan
      • South Korea
    • South America
      • Brazil
    • Rest of World (ROW)

By Deployment Insights

The cloud segment is estimated to witness significant growth during the forecast period.

The market continues to evolve, with the cloud segment leading the charge. This sector's growth is driven by its ability to offer scalability, agility, cost efficiency, and unmatched data processing power. In contrast to traditional IT infrastructure, cloud-based solutions provide a flexible, pay-as-you-go model, making them increasingly popular for ESG analytics. These analyses require handling large, heterogeneous datasets, such as satellite imagery for environmental monitoring or text from news articles for stakeholder sentiment analysis. For instance, machine learning and deep learning algorithms are used for carbon footprint modeling, waste management, and energy efficiency, while predictive modeling and data visualization tools support ESG reporting automation and performance metrics.

Moreover, AI is also employed for risk management, impact investing, and materiality assessment, contributing to the circular economy, renewable energy, ethical sourcing, and water footprint assessment. According to recent estimates, The market is projected to grow at a compound annual growth rate of 22.5% between 2021 and 2028, reaching a value of USD11.1 billion by 2028.

AI In ESG And Sustainability Market Size

Request Free Sample

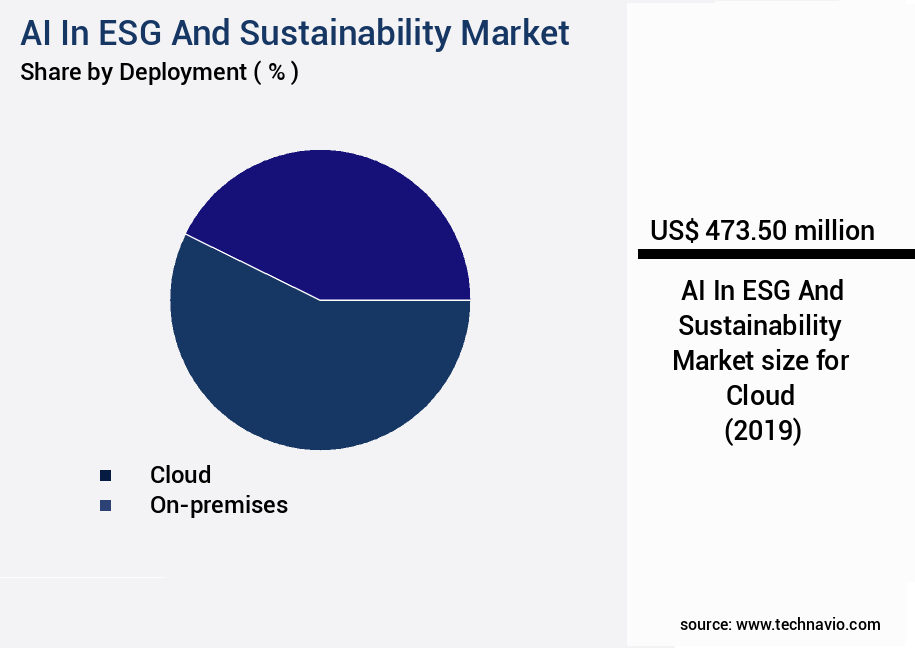
The Cloud segment was valued at USD 473.50 billion in 2019 and showed a gradual increase during the forecast period.

AI In ESG And Sustainability Market Size

Request Free Sample

Regional Analysis

APAC is estimated to contribute 34% to the growth of the global market during the forecast period.Technavio's analysts have elaborately explained the regional trends and drivers that shape the market during the forecast period.

AI In ESG And Sustainability Market Share by Geography

See How AI In ESG And Sustainability Market Demand is Rising in APAC Request Free Sample

The APAC region showcases a diverse and evolving market for Artificial Intelligence (AI) in Environmental, Social, and Governance (ESG) and sustainability. With a growing emphasis on addressing environmental challenges and harnessing the potential of green technology, the market's dynamics vary significantly from more homogenous regions like North America and Europe. Government-led initiatives are a primary driver in APAC, with countries such as Japan, Singapore, and Australia implementing sophisticated ESG frameworks. Simultaneously, developing nations are witnessing an accelerating adoption of AI in ESG and sustainability. This heterogeneity offers a rich landscape of opportunities and challenges. Environmental concerns, including air and water pollution, fuel the market's growth.

Market Dynamics

Our researchers analyzed the data with 2024 as the base year, along with the key drivers, trends, and challenges. A holistic analysis of drivers will help companies refine their marketing strategies to gain a competitive advantage.

The market is experiencing significant growth as businesses seek to enhance their environmental, social, and governance (ESG) performance through advanced technological solutions. AI-powered ESG performance tracking enables companies to monitor and analyze their ESG metrics in real-time, while machine learning for ESG risk management helps identify potential risks and opportunities. Natural language processing (NLP) is used to extract insights from ESG reports, making data more accessible and actionable for decision-makers. Predictive analytics for sustainable supply chains allows businesses to anticipate disruptions and optimize their operations, while AI-driven solutions for corporate social responsibility help companies demonstrate their commitment to ethical business practices. ESG data visualization and reporting tools powered by AI provide stakeholders with clear and insightful data, while AI algorithms for environmental impact assessment offer accurate and detailed assessments of carbon footprints and other environmental metrics.

Deep learning models for carbon footprint reduction enable companies to identify areas for improvement and optimize their energy usage. Responsible AI in ESG decision-making is essential to ensure ethical considerations are integrated into AI systems. AI-based stakeholder engagement strategies enable companies to build stronger relationships with stakeholders, while data-driven insights for sustainable investing provide valuable information for investors. AI-enabled sustainability reporting frameworks offer advanced analytics for ESG performance improvement, while AI solutions for environmental compliance help businesses meet regulatory requirements. AI-driven monitoring of greenhouse gas emissions and big data analytics for ESG risk identification offer valuable insights for risk management. Furthermore, AI and blockchain are being used to enhance supply chain sustainability by providing transparency and traceability. Machine learning models for waste reduction and AI-powered solutions for water resource management offer opportunities for significant cost savings and environmental benefits. Overall, the market is transforming the way businesses approach sustainability, offering valuable insights and solutions for improving ESG performance and reducing environmental impact.

AI In ESG And Sustainability Market Size

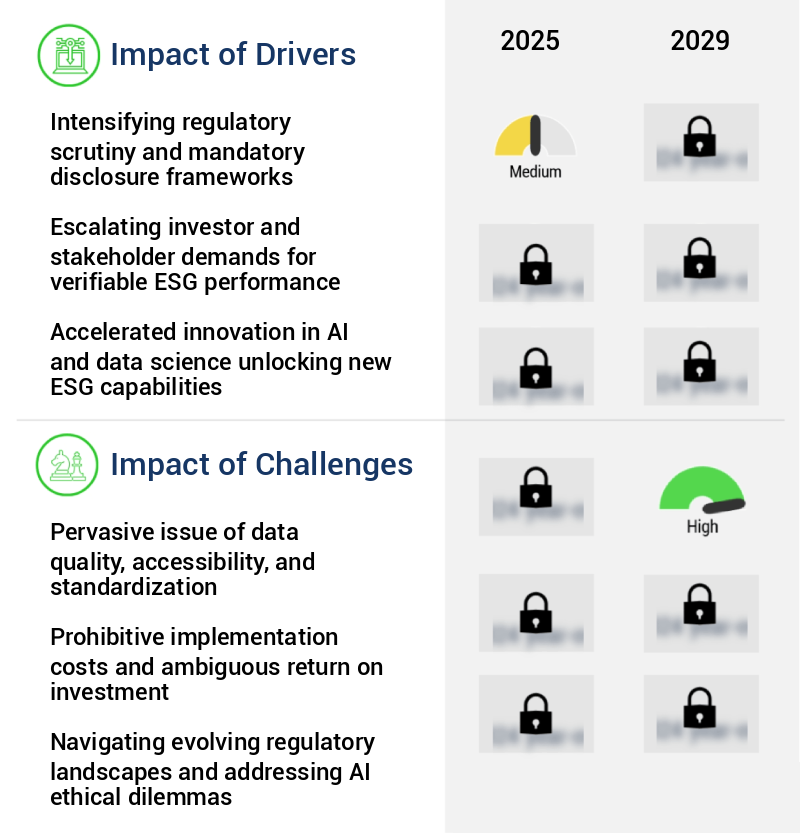
What are the key market drivers leading to the rise in the adoption of AI In ESG And Sustainability Industry?

  • Mandatory disclosure frameworks and intensified regulatory scrutiny serve as primary catalysts for market compliance and transparency. 
  • The global AI application in Environmental, Social, and Governance (ESG) and sustainability markets is undergoing a transformative evolution, moving from voluntary reporting to mandatory disclosure frameworks. This shift significantly alters the corporate compliance landscape, elevating ESG data management from a peripheral public relations activity to a core business requirement, akin in importance to financial accounting. The escalating demand for stringent data handling stems from the sheer volume, intricacy, and granularity of data required under these new regulations. Traditional, manual methods of data collection and reporting are no longer viable, necessitating the implementation of advanced AI-driven solutions.
  • These platforms automate data aggregation from disparate sources, ensure data accuracy, facilitate adherence to multiple regulatory frameworks, and offer the analytical depth needed for comprehensive, auditable disclosures.

What are the market trends shaping the AI In ESG And Sustainability Industry?

  • The trend in the market is toward the hyper-automation of Environmental, Social, and Governance (ESG) data collection, assurance, and reporting. This process ensures efficiency, accuracy, and compliance in managing ESG information.
  • The global AI in Environmental, Social, and Governance (ESG) and sustainability market is witnessing a significant shift towards hyper-automation in data management. This evolution signifies a progression from basic data collection to a comprehensive, AI-driven ecosystem for managing ESG metrics. The primary catalyst for this trend is the increasing intricacy and expansiveness of regulatory mandates worldwide. In Europe, the Corporate Sustainability Reporting Directive (CSRD) necessitates robust, auditable data trails, compelling thousands of companies to disclose extensive sustainability information. Similarly, in North America, the Securities and Exchange Commission's proposed climate disclosure rules, despite facing legal challenges, underscore a clear intention towards mandatory reporting.
  • This surge in regulatory requirements underscores the importance of AI technologies in streamlining and enhancing ESG data management processes.

What challenges does the AI In ESG And Sustainability Industry face during its growth?

  • The pervasive challenge of ensuring data quality, accessibility, and standardization is a critical issue impeding industry growth. This complex problem necessitates the implementation of robust solutions to address data inconsistencies, enhance data accessibility, and establish industry-wide data standardization. Failure to effectively tackle these concerns may hinder business expansion and competitiveness. 
  • The integration of artificial intelligence (AI) in the Environmental, Social, and Governance (ESG) and sustainability market is a response to the fragmented and inconsistent nature of relevant data. AI models, specifically machine learning and deep learning algorithms, require large volumes of high-quality, structured, and labeled data for training and validation. However, the ESG domain is marked by a nascent and complex data ecosystem, with a significant portion of critical sustainability information residing in unstructured formats such as annual reports, press releases, NGO analyses, and news articles. Extracting and standardizing this data is a labor-intensive and technologically complex process, leading to potential errors and interpretation bias.
  • Despite these challenges, the potential benefits of AI in ESG and sustainability are substantial, with recent studies estimating that The market will reach USDXX billion by 20XX, growing at a robust rate. This growth is driven by the need for accurate and timely insights to inform business decisions, enhance transparency, and improve overall sustainability performance.

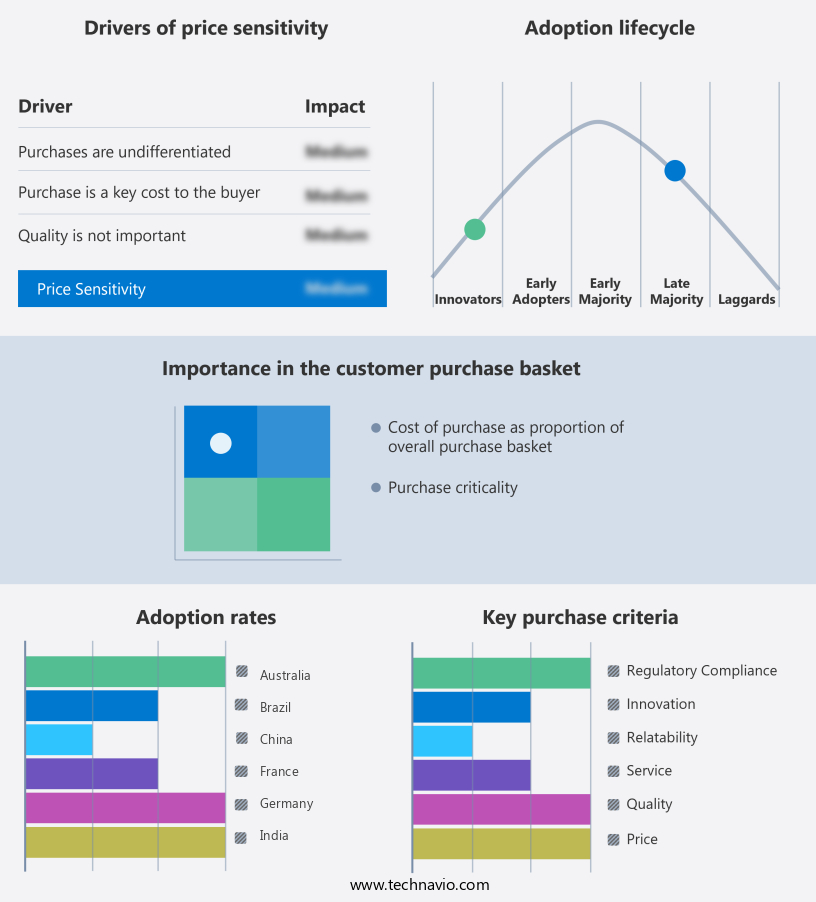
Exclusive Technavio Analysis on Customer Landscape

The ai in esg and sustainability market forecasting report includes the adoption lifecycle of the market, covering from the innovator's stage to the laggard's stage. It focuses on adoption rates in different regions based on penetration. Furthermore, the ai in esg and sustainability market report also includes key purchase criteria and drivers of price sensitivity to help companies evaluate and develop their market growth analysis strategies.

AI In ESG And Sustainability Market Share by Geography

 Customer Landscape of AI In ESG And Sustainability Industry

Competitive Landscape

Companies are implementing various strategies, such as strategic alliances, ai in esg and sustainability market forecast, partnerships, mergers and acquisitions, geographical expansion, and product/service launches, to enhance their presence in the industry.

Briink Intelligence GmbH - The company's ESG AI Toolbox leverages advanced artificial intelligence to streamline disclosures, due diligence, and policy screening in environmental, social, and governance (ESG) analysis. Fine-tuned language models automate this process, ensuring comprehensive and accurate ESG evaluations.

The industry research and growth report includes detailed analyses of the competitive landscape of the market and information about key companies, including:

  • Briink Intelligence GmbH
  • Clarity AI Inc.
  • Dcycle
  • Exowatt Inc.
  • FactSet Research Systems Inc.
  • GaiaLens Ltd.
  • GLYNT.AI Inc.
  • Google LLC
  • International Business Machines Corp.
  • KANINI Software Solutions
  • Microsoft Corp.
  • Persefoni AI Inc.
  • Salesforce Inc.
  • SAP SE
  • Sunairio
  • Sweep.io Ltd.
  • Watershed Technology Inc.
  • Workiva Inc.

Qualitative and quantitative analysis of companies has been conducted to help clients understand the wider business environment as well as the strengths and weaknesses of key industry players. Data is qualitatively analyzed to categorize companies as pure play, category-focused, industry-focused, and diversified; it is quantitatively analyzed to categorize companies as dominant, leading, strong, tentative, and weak.

Recent Development and News in AI In ESG And Sustainability Market

  • In January 2024, Sustainalytics, a leading ESG research, data, and analytics firm, announced the launch of its new AI-powered ESG Risk Rating platform (Sustainalytics.Com). This advanced solution utilizes machine learning algorithms to analyze vast amounts of data and assess the ESG risks for companies worldwide.
  • In March 2024, IBM and Microsoft, two technology giants, formed a strategic partnership to accelerate their AI and sustainability initiatives (IBM.Com). They pledged to collaborate on AI projects in areas such as climate modeling, renewable energy, and circular economy.
  • In July 2024, BlackRock, the world's largest asset manager, invested USD1 billion in a new sustainability-focused technology fund (BlackRock.Com). This fund, which utilizes AI to identify and invest in companies with strong ESG performance, is a significant step forward in the integration of AI and ESG.
  • In May 2025, the European Union's Sustainable Finance Disclosure Regulation (SFDR) came into effect (EU Commission). This regulation mandates financial market participants to disclose the extent to which they consider ESG risks in their investment decision-making processes. Several AI-powered ESG solutions, such as those from MSCI and Bloomberg, were instrumental in helping firms comply with this regulation.

Dive into Technavio's robust research methodology, blending expert interviews, extensive data synthesis, and validated models for unparalleled AI In ESG And Sustainability Market insights. See full methodology.

Market Scope

Report Coverage

Details

Page number

247

Base year

2024

Historic period

2019-2023

Forecast period

2025-2029

Growth momentum & CAGR

Accelerate at a CAGR of 29.3%

Market growth 2025-2029

USD 3465.9 million

Market structure

Fragmented

YoY growth 2024-2025(%)

24.4

Key countries

US, China, Japan, India, Germany, UK, France, Brazil, South Korea, and Australia

Competitive landscape

Leading Companies, Market Positioning of Companies, Competitive Strategies, and Industry Risks

Request Free Sample

Research Analyst Overview

  • The Environmental, Social, and Governance (ESG) market continues to evolve, with Artificial Intelligence (AI) playing an increasingly significant role. AI applications in ESG span various sectors, including environmental monitoring, waste management, carbon footprint modeling, and ESG reporting automation. For instance, a leading waste management company leverages AI to optimize waste sorting and reduce landfill usage by up to 30%. Environmental Impact AI is another burgeoning application, enabling accurate assessment and prediction of a company's carbon footprint. Impact Investing AI streamlines the investment decision-making process by analyzing ESG data and identifying potential investments aligned with sustainability goals. Materiality Assessment AI and ESG Performance Metrics help organizations prioritize ESG initiatives based on their impact on business performance and stakeholder expectations.
  • Compliance Automation AI ensures adherence to ESG regulations, reducing the risk of non-compliance. Deep Learning and Machine Learning ESG models enhance data visualization and analysis, providing valuable insights for risk management and stakeholder engagement. AI-driven sustainability solutions also encompass Social Impact Measurement, Governance Risk AI, Circular Economy AI, Renewable Energy AI, Ethical Sourcing AI, Water Footprint Assessment, and Environmental Risk Scoring. According to recent market research, the global ESG market is expected to grow by over 15% annually, underscoring the increasing importance of AI in ESG and sustainability initiatives.

What are the Key Data Covered in this AI In ESG And Sustainability Market Research and Growth Report?

  • What is the expected growth of the AI In ESG And Sustainability Market between 2025 and 2029?

    • USD 3.47 billion, at a CAGR of 29.3%

  • What segmentation does the market report cover?

    • The report is segmented by Deployment (Cloud and On-premises), End-user (Building and construction, Oil and gas, Agriculture, Food and beverage, and Others), Technology (Machine learning, Generative AI, Deep learning, Natural language processing (NLP), and Predictive analysis), and Geography (APAC, North America, Europe, Middle East and Africa, and South America)

  • Which regions are analyzed in the report?

    • APAC, North America, Europe, Middle East and Africa, and South America

  • What are the key growth drivers and market challenges?

    • Intensifying regulatory scrutiny and mandatory disclosure frameworks, Pervasive issue of data quality, accessibility, and standardization

  • Who are the major players in the AI In ESG And Sustainability Market?

    • Briink Intelligence GmbH, Clarity AI Inc., Dcycle, Exowatt Inc., FactSet Research Systems Inc., GaiaLens Ltd., GLYNT.AI Inc., Google LLC, International Business Machines Corp., KANINI Software Solutions, Microsoft Corp., Persefoni AI Inc., Salesforce Inc., SAP SE, Sunairio, Sweep.io Ltd., Watershed Technology Inc., and Workiva Inc.

Market Research Insights

  • The market for AI in Environmental, Social, and Governance (ESG) and sustainability continues to evolve, integrating advanced technologies to streamline processes and enhance decision-making. Two notable developments include the adoption of Explainable AI (XAI) for ESG due diligence and the implementation of Ethical AI algorithms for carbon accounting. XAI ESG solutions enable organizations to understand the reasoning behind AI-driven ESG assessments, ensuring transparency and accountability. For instance, these systems can analyze a company's supply chain and identify potential ESG risks, providing clear explanations for their findings. Moreover, the market anticipates significant growth, with industry experts projecting a 20% compound annual growth rate (CAGR) in the next five years.
  • This expansion is driven by the increasing importance of ESG factors in business strategies and the need for more efficient and accurate sustainability reporting. By integrating AI technologies into their ESG and sustainability efforts, organizations can improve their ESG risk assessments, stakeholder mapping, governance effectiveness, and communication strategies, ultimately contributing to better sustainability outcomes.

We can help! Our analysts can customize this ai in esg and sustainability market research report to meet your requirements.

Get in touch

1 Executive Summary

  • 1.1 Market overview
    • Executive Summary - Chart on Market Overview
    • Executive Summary - Data Table on Market Overview
    • Executive Summary - Chart on Global Market Characteristics
    • Executive Summary - Chart on Market by Geography
    • Executive Summary - Chart on Market Segmentation by Deployment
    • Executive Summary - Chart on Market Segmentation by End-user
    • Executive Summary - Chart on Market Segmentation by Technology
    • Executive Summary - Chart on Incremental Growth
    • Executive Summary - Data Table on Incremental Growth
    • Executive Summary - Chart on Company Market Positioning

2 Technavio Analysis

  • 2.1 Analysis of price sensitivity, lifecycle, customer purchase basket, adoption rates, and purchase criteria
    • Analysis of price sensitivity, lifecycle, customer purchase basket, adoption rates, and purchase criteria
  • 2.2 Criticality of inputs and Factors of differentiation
    • Overview on criticality of inputs and factors of differentiation
  • 2.3 Factors of disruption
    • Overview on factors of disruption
  • 2.4 Impact of drivers and challenges
    • Impact of drivers and challenges in 2024 and 2029

3 Market Landscape

  • 3.1 Market ecosystem
    • Parent Market
    • Data Table on - Parent Market
  • 3.2 Market characteristics
    • Market characteristics analysis
  • 3.3 Value chain analysis
    • Value chain analysis

4 Market Sizing

  • 4.1 Market definition
    • Offerings of companies included in the market definition
  • 4.2 Market segment analysis
    • Market segments
  • 4.3 Market size 2024
    • 4.4 Market outlook: Forecast for 2024-2029
      • Chart on Global - Market size and forecast 2024-2029 ($ million)
      • Data Table on Global - Market size and forecast 2024-2029 ($ million)
      • Chart on Global Market: Year-over-year growth 2024-2029 (%)
      • Data Table on Global Market: Year-over-year growth 2024-2029 (%)

    5 Historic Market Size

    • 5.1 Global AI In ESG And Sustainability Market 2019 - 2023
      • Historic Market Size - Data Table on Global AI In ESG And Sustainability Market 2019 - 2023 ($ million)
    • 5.2 Deployment segment analysis 2019 - 2023
      • Historic Market Size - Deployment Segment 2019 - 2023 ($ million)
    • 5.3 End-user segment analysis 2019 - 2023
      • Historic Market Size - End-user Segment 2019 - 2023 ($ million)
    • 5.4 Technology segment analysis 2019 - 2023
      • Historic Market Size - Technology Segment 2019 - 2023 ($ million)
    • 5.5 Geography segment analysis 2019 - 2023
      • Historic Market Size - Geography Segment 2019 - 2023 ($ million)
    • 5.6 Country segment analysis 2019 - 2023
      • Historic Market Size - Country Segment 2019 - 2023 ($ million)

    6 Five Forces Analysis

    • 6.1 Five forces summary
      • Five forces analysis - Comparison between 2024 and 2029
    • 6.2 Bargaining power of buyers
      • Bargaining power of buyers - Impact of key factors 2024 and 2029
    • 6.3 Bargaining power of suppliers
      • Bargaining power of suppliers - Impact of key factors in 2024 and 2029
    • 6.4 Threat of new entrants
      • Threat of new entrants - Impact of key factors in 2024 and 2029
    • 6.5 Threat of substitutes
      • Threat of substitutes - Impact of key factors in 2024 and 2029
    • 6.6 Threat of rivalry
      • Threat of rivalry - Impact of key factors in 2024 and 2029
    • 6.7 Market condition
      • Chart on Market condition - Five forces 2024 and 2029

    7 Market Segmentation by Deployment

    • 7.1 Market segments
      • Chart on Deployment - Market share 2024-2029 (%)
      • Data Table on Deployment - Market share 2024-2029 (%)
    • 7.2 Comparison by Deployment
      • Chart on Comparison by Deployment
      • Data Table on Comparison by Deployment
    • 7.3 Cloud - Market size and forecast 2024-2029
      • Chart on Cloud - Market size and forecast 2024-2029 ($ million)
      • Data Table on Cloud - Market size and forecast 2024-2029 ($ million)
      • Chart on Cloud - Year-over-year growth 2024-2029 (%)
      • Data Table on Cloud - Year-over-year growth 2024-2029 (%)
    • 7.4 On-premises - Market size and forecast 2024-2029
      • Chart on On-premises - Market size and forecast 2024-2029 ($ million)
      • Data Table on On-premises - Market size and forecast 2024-2029 ($ million)
      • Chart on On-premises - Year-over-year growth 2024-2029 (%)
      • Data Table on On-premises - Year-over-year growth 2024-2029 (%)
    • 7.5 Market opportunity by Deployment
      • Market opportunity by Deployment ($ million)
      • Data Table on Market opportunity by Deployment ($ million)

    8 Market Segmentation by End-user

    • 8.1 Market segments
      • Chart on End-user - Market share 2024-2029 (%)
      • Data Table on End-user - Market share 2024-2029 (%)
    • 8.2 Comparison by End-user
      • Chart on Comparison by End-user
      • Data Table on Comparison by End-user
    • 8.3 Building and construction - Market size and forecast 2024-2029
      • Chart on Building and construction - Market size and forecast 2024-2029 ($ million)
      • Data Table on Building and construction - Market size and forecast 2024-2029 ($ million)
      • Chart on Building and construction - Year-over-year growth 2024-2029 (%)
      • Data Table on Building and construction - Year-over-year growth 2024-2029 (%)
    • 8.4 Oil and gas - Market size and forecast 2024-2029
      • Chart on Oil and gas - Market size and forecast 2024-2029 ($ million)
      • Data Table on Oil and gas - Market size and forecast 2024-2029 ($ million)
      • Chart on Oil and gas - Year-over-year growth 2024-2029 (%)
      • Data Table on Oil and gas - Year-over-year growth 2024-2029 (%)
    • 8.5 Agriculture - Market size and forecast 2024-2029
      • Chart on Agriculture - Market size and forecast 2024-2029 ($ million)
      • Data Table on Agriculture - Market size and forecast 2024-2029 ($ million)
      • Chart on Agriculture - Year-over-year growth 2024-2029 (%)
      • Data Table on Agriculture - Year-over-year growth 2024-2029 (%)
    • 8.6 Food and beverage - Market size and forecast 2024-2029
      • Chart on Food and beverage - Market size and forecast 2024-2029 ($ million)
      • Data Table on Food and beverage - Market size and forecast 2024-2029 ($ million)
      • Chart on Food and beverage - Year-over-year growth 2024-2029 (%)
      • Data Table on Food and beverage - Year-over-year growth 2024-2029 (%)
    • 8.7 Others - Market size and forecast 2024-2029
      • Chart on Others - Market size and forecast 2024-2029 ($ million)
      • Data Table on Others - Market size and forecast 2024-2029 ($ million)
      • Chart on Others - Year-over-year growth 2024-2029 (%)
      • Data Table on Others - Year-over-year growth 2024-2029 (%)
    • 8.8 Market opportunity by End-user
      • Market opportunity by End-user ($ million)
      • Data Table on Market opportunity by End-user ($ million)

    9 Market Segmentation by Technology

    • 9.1 Market segments
      • Chart on Technology - Market share 2024-2029 (%)
      • Data Table on Technology - Market share 2024-2029 (%)
    • 9.2 Comparison by Technology
      • Chart on Comparison by Technology
      • Data Table on Comparison by Technology
    • 9.3 Machine learning - Market size and forecast 2024-2029
      • Chart on Machine learning - Market size and forecast 2024-2029 ($ million)
      • Data Table on Machine learning - Market size and forecast 2024-2029 ($ million)
      • Chart on Machine learning - Year-over-year growth 2024-2029 (%)
      • Data Table on Machine learning - Year-over-year growth 2024-2029 (%)
    • 9.4 Generative AI - Market size and forecast 2024-2029
      • Chart on Generative AI - Market size and forecast 2024-2029 ($ million)
      • Data Table on Generative AI - Market size and forecast 2024-2029 ($ million)
      • Chart on Generative AI - Year-over-year growth 2024-2029 (%)
      • Data Table on Generative AI - Year-over-year growth 2024-2029 (%)
    • 9.5 Deep learning - Market size and forecast 2024-2029
      • Chart on Deep learning - Market size and forecast 2024-2029 ($ million)
      • Data Table on Deep learning - Market size and forecast 2024-2029 ($ million)
      • Chart on Deep learning - Year-over-year growth 2024-2029 (%)
      • Data Table on Deep learning - Year-over-year growth 2024-2029 (%)
    • 9.6 Natural language processing (NLP) - Market size and forecast 2024-2029
      • Chart on Natural language processing (NLP) - Market size and forecast 2024-2029 ($ million)
      • Data Table on Natural language processing (NLP) - Market size and forecast 2024-2029 ($ million)
      • Chart on Natural language processing (NLP) - Year-over-year growth 2024-2029 (%)
      • Data Table on Natural language processing (NLP) - Year-over-year growth 2024-2029 (%)
    • 9.7 Predictive analysis - Market size and forecast 2024-2029
      • Chart on Predictive analysis - Market size and forecast 2024-2029 ($ million)
      • Data Table on Predictive analysis - Market size and forecast 2024-2029 ($ million)
      • Chart on Predictive analysis - Year-over-year growth 2024-2029 (%)
      • Data Table on Predictive analysis - Year-over-year growth 2024-2029 (%)
    • 9.8 Market opportunity by Technology
      • Market opportunity by Technology ($ million)
      • Data Table on Market opportunity by Technology ($ million)

    10 Customer Landscape

    • 10.1 Customer landscape overview
      • Analysis of price sensitivity, lifecycle, customer purchase basket, adoption rates, and purchase criteria

    11 Geographic Landscape

    • 11.1 Geographic segmentation
      • Chart on Market share by geography 2024-2029 (%)
      • Data Table on Market share by geography 2024-2029 (%)
    • 11.2 Geographic comparison
      • Chart on Geographic comparison
      • Data Table on Geographic comparison
    • 11.3 APAC - Market size and forecast 2024-2029
      • Chart on APAC - Market size and forecast 2024-2029 ($ million)
      • Data Table on APAC - Market size and forecast 2024-2029 ($ million)
      • Chart on APAC - Year-over-year growth 2024-2029 (%)
      • Data Table on APAC - Year-over-year growth 2024-2029 (%)
    • 11.4 North America - Market size and forecast 2024-2029
      • Chart on North America - Market size and forecast 2024-2029 ($ million)
      • Data Table on North America - Market size and forecast 2024-2029 ($ million)
      • Chart on North America - Year-over-year growth 2024-2029 (%)
      • Data Table on North America - Year-over-year growth 2024-2029 (%)
    • 11.5 Europe - Market size and forecast 2024-2029
      • Chart on Europe - Market size and forecast 2024-2029 ($ million)
      • Data Table on Europe - Market size and forecast 2024-2029 ($ million)
      • Chart on Europe - Year-over-year growth 2024-2029 (%)
      • Data Table on Europe - Year-over-year growth 2024-2029 (%)
    • 11.6 Middle East and Africa - Market size and forecast 2024-2029
      • Chart on Middle East and Africa - Market size and forecast 2024-2029 ($ million)
      • Data Table on Middle East and Africa - Market size and forecast 2024-2029 ($ million)
      • Chart on Middle East and Africa - Year-over-year growth 2024-2029 (%)
      • Data Table on Middle East and Africa - Year-over-year growth 2024-2029 (%)
    • 11.7 South America - Market size and forecast 2024-2029
      • Chart on South America - Market size and forecast 2024-2029 ($ million)
      • Data Table on South America - Market size and forecast 2024-2029 ($ million)
      • Chart on South America - Year-over-year growth 2024-2029 (%)
      • Data Table on South America - Year-over-year growth 2024-2029 (%)
    • 11.8 US - Market size and forecast 2024-2029
      • Chart on US - Market size and forecast 2024-2029 ($ million)
      • Data Table on US - Market size and forecast 2024-2029 ($ million)
      • Chart on US - Year-over-year growth 2024-2029 (%)
      • Data Table on US - Year-over-year growth 2024-2029 (%)
    • 11.9 China - Market size and forecast 2024-2029
      • Chart on China - Market size and forecast 2024-2029 ($ million)
      • Data Table on China - Market size and forecast 2024-2029 ($ million)
      • Chart on China - Year-over-year growth 2024-2029 (%)
      • Data Table on China - Year-over-year growth 2024-2029 (%)
    • 11.10 Japan - Market size and forecast 2024-2029
      • Chart on Japan - Market size and forecast 2024-2029 ($ million)
      • Data Table on Japan - Market size and forecast 2024-2029 ($ million)
      • Chart on Japan - Year-over-year growth 2024-2029 (%)
      • Data Table on Japan - Year-over-year growth 2024-2029 (%)
    • 11.11 India - Market size and forecast 2024-2029
      • Chart on India - Market size and forecast 2024-2029 ($ million)
      • Data Table on India - Market size and forecast 2024-2029 ($ million)
      • Chart on India - Year-over-year growth 2024-2029 (%)
      • Data Table on India - Year-over-year growth 2024-2029 (%)
    • 11.12 Germany - Market size and forecast 2024-2029
      • Chart on Germany - Market size and forecast 2024-2029 ($ million)
      • Data Table on Germany - Market size and forecast 2024-2029 ($ million)
      • Chart on Germany - Year-over-year growth 2024-2029 (%)
      • Data Table on Germany - Year-over-year growth 2024-2029 (%)
    • 11.13 UK - Market size and forecast 2024-2029
      • Chart on UK - Market size and forecast 2024-2029 ($ million)
      • Data Table on UK - Market size and forecast 2024-2029 ($ million)
      • Chart on UK - Year-over-year growth 2024-2029 (%)
      • Data Table on UK - Year-over-year growth 2024-2029 (%)
    • 11.14 France - Market size and forecast 2024-2029
      • Chart on France - Market size and forecast 2024-2029 ($ million)
      • Data Table on France - Market size and forecast 2024-2029 ($ million)
      • Chart on France - Year-over-year growth 2024-2029 (%)
      • Data Table on France - Year-over-year growth 2024-2029 (%)
    • 11.15 South Korea - Market size and forecast 2024-2029
      • Chart on South Korea - Market size and forecast 2024-2029 ($ million)
      • Data Table on South Korea - Market size and forecast 2024-2029 ($ million)
      • Chart on South Korea - Year-over-year growth 2024-2029 (%)
      • Data Table on South Korea - Year-over-year growth 2024-2029 (%)
    • 11.16 Brazil - Market size and forecast 2024-2029
      • Chart on Brazil - Market size and forecast 2024-2029 ($ million)
      • Data Table on Brazil - Market size and forecast 2024-2029 ($ million)
      • Chart on Brazil - Year-over-year growth 2024-2029 (%)
      • Data Table on Brazil - Year-over-year growth 2024-2029 (%)
    • 11.17 Australia - Market size and forecast 2024-2029
      • Chart on Australia - Market size and forecast 2024-2029 ($ million)
      • Data Table on Australia - Market size and forecast 2024-2029 ($ million)
      • Chart on Australia - Year-over-year growth 2024-2029 (%)
      • Data Table on Australia - Year-over-year growth 2024-2029 (%)
    • 11.18 Market opportunity by geography
      • Market opportunity by geography ($ million)
      • Data Tables on Market opportunity by geography ($ million)

    12 Drivers, Challenges, and Opportunity/Restraints

    • 12.1 Market drivers
      • 12.2 Market challenges
        • 12.3 Impact of drivers and challenges
          • Impact of drivers and challenges in 2024 and 2029
        • 12.4 Market opportunities/restraints

          13 Competitive Landscape

          • 13.1 Overview
            • 13.2 Competitive Landscape
              • Overview on criticality of inputs and factors of differentiation
            • 13.3 Landscape disruption
              • Overview on factors of disruption
            • 13.4 Industry risks
              • Impact of key risks on business

            14 Competitive Analysis

            • 14.1 Companies profiled
              • Companies covered
            • 14.2 Company ranking index
              • Company ranking index
            • 14.3 Market positioning of companies
              • Matrix on companies position and classification
            • 14.4 Briink Intelligence GmbH
              • Briink Intelligence GmbH - Overview
              • Briink Intelligence GmbH - Product / Service
              • Briink Intelligence GmbH - Key offerings
              • SWOT
            • 14.5 Clarity AI Inc.
              • Clarity AI Inc. - Overview
              • Clarity AI Inc. - Product / Service
              • Clarity AI Inc. - Key offerings
              • SWOT
            • 14.6 Dcycle
              • Dcycle - Overview
              • Dcycle - Product / Service
              • Dcycle - Key offerings
              • SWOT
            • 14.7 GaiaLens Ltd.
              • GaiaLens Ltd. - Overview
              • GaiaLens Ltd. - Product / Service
              • GaiaLens Ltd. - Key offerings
              • SWOT
            • 14.8 GLYNT.AI Inc.
              • GLYNT.AI Inc. - Overview
              • GLYNT.AI Inc. - Product / Service
              • GLYNT.AI Inc. - Key offerings
              • SWOT
            • 14.9 Google LLC
              • Google LLC - Overview
              • Google LLC - Product / Service
              • Google LLC - Key offerings
              • SWOT
            • 14.10 International Business Machines Corp.
              • International Business Machines Corp. - Overview
              • International Business Machines Corp. - Business segments
              • International Business Machines Corp. - Key news
              • International Business Machines Corp. - Key offerings
              • International Business Machines Corp. - Segment focus
              • SWOT
            • 14.11 KANINI Software Solutions
              • KANINI Software Solutions - Overview
              • KANINI Software Solutions - Product / Service
              • KANINI Software Solutions - Key offerings
              • SWOT
            • 14.12 Microsoft Corp.
              • Microsoft Corp. - Overview
              • Microsoft Corp. - Business segments
              • Microsoft Corp. - Key news
              • Microsoft Corp. - Key offerings
              • Microsoft Corp. - Segment focus
              • SWOT
            • 14.13 Persefoni AI Inc.
              • Persefoni AI Inc. - Overview
              • Persefoni AI Inc. - Product / Service
              • Persefoni AI Inc. - Key offerings
              • SWOT
            • 14.14 Salesforce Inc.
              • Salesforce Inc. - Overview
              • Salesforce Inc. - Product / Service
              • Salesforce Inc. - Key news
              • Salesforce Inc. - Key offerings
              • SWOT
            • 14.15 SAP SE
              • SAP SE - Overview
              • SAP SE - Business segments
              • SAP SE - Key news
              • SAP SE - Key offerings
              • SAP SE - Segment focus
              • SWOT
            • 14.16 Sweep.io Ltd.
              • Sweep.io Ltd. - Overview
              • Sweep.io Ltd. - Product / Service
              • Sweep.io Ltd. - Key offerings
              • SWOT
            • 14.17 Watershed Technology Inc.
              • Watershed Technology Inc. - Overview
              • Watershed Technology Inc. - Product / Service
              • Watershed Technology Inc. - Key offerings
              • SWOT
            • 14.18 Workiva Inc.
              • Workiva Inc. - Overview
              • Workiva Inc. - Product / Service
              • Workiva Inc. - Key offerings
              • SWOT

            15 Appendix

            • 15.1 Scope of the report
              • 15.2 Inclusions and exclusions checklist
                • Inclusions checklist
                • Exclusions checklist
              • 15.3 Currency conversion rates for US$
                • Currency conversion rates for US$
              • 15.4 Research methodology
                • Research methodology
              • 15.5 Data procurement
                • Information sources
              • 15.6 Data validation
                • Data validation
              • 15.7 Validation techniques employed for market sizing
                • Validation techniques employed for market sizing
              • 15.8 Data synthesis
                • Data synthesis
              • 15.9 360 degree market analysis
                • 360 degree market analysis
              • 15.10 List of abbreviations
                • List of abbreviations

              Research Methodology

              Technavio presents a detailed picture of the market by way of study, synthesis, and summation of data from multiple sources. The analysts have presented the various facets of the market with a particular focus on identifying the key industry influencers. The data thus presented is comprehensive, reliable, and the result of extensive research, both primary and secondary.

              INFORMATION SOURCES

              Primary sources

              • Manufacturers and suppliers
              • Channel partners
              • Industry experts
              • Strategic decision makers

              Secondary sources

              • Industry journals and periodicals
              • Government data
              • Financial reports of key industry players
              • Historical data
              • Press releases

              DATA ANALYSIS

              Data Synthesis

              • Collation of data
              • Estimation of key figures
              • Analysis of derived insights

              Data Validation

              • Triangulation with data models
              • Reference against proprietary databases
              • Corroboration with industry experts

              REPORT WRITING

              Qualitative

              • Market drivers
              • Market challenges
              • Market trends
              • Five forces analysis

              Quantitative

              • Market size and forecast
              • Market segmentation
              • Geographical insights
              • Competitive landscape

              Interested in this report?

              Get your sample now to see our research methodology and insights!

              Download Now

              Frequently Asked Questions

              Ai In Esg And Sustainability market growth will increase by $ 3465.9 mn during 2025-2029.

              The Ai In Esg And Sustainability market is expected to grow at a CAGR of 29.3% during 2025-2029.

              Ai In Esg And Sustainability market is segmented by Deployment( Cloud, On-premises) End-user( Building and construction, Oil and gas, Agriculture, Food and beverage, Others) Technology( Machine learning, Generative AI, Deep learning, Natural language processing (NLP), Predictive analysis)

              Briink Intelligence GmbH, Clarity AI Inc., Dcycle, Exowatt Inc., FactSet Research Systems Inc., GaiaLens Ltd., GLYNT.AI Inc., Google LLC, International Business Machines Corp., KANINI Software Solutions, Microsoft Corp., Persefoni AI Inc., Salesforce Inc., SAP SE, Sunairio, Sweep.io Ltd., Watershed Technology Inc., Workiva Inc. are a few of the key vendors in the Ai In Esg And Sustainability market.

              APAC will register the highest growth rate of 34% among the other regions. Therefore, the Ai In Esg And Sustainability market in APAC is expected to garner significant business opportunities for the vendors during the forecast period.

              US, China, Japan, India, Germany, UK, France, Brazil, South Korea, Australia

              • Intensifying regulatory scrutiny and mandatory disclosure frameworksThe global AI in ESG and sustainability market is the paradigm shift from voluntary is the driving factor this market.
              • principle-based reporting to stringent is the driving factor this market.
              • mandatory disclosure frameworks enacted by governments and regulatory bodies worldwide. This transition has fundamentally altered the corporate compliance landscape is the driving factor this market.
              • transforming ESG data management from a peripheral public relations activity into a core business imperative equivalent in rigor to financial accounting. The sheer volume is the driving factor this market.
              • complexity is the driving factor this market.
              • and granularity of data required under these new mandates make traditional is the driving factor this market.
              • manual methods of collection and reporting untenable is the driving factor this market.
              • creating a significant and urgent demand for sophisticated AI-powered solutions. These platforms are essential for automating data aggregation from disparate sources is the driving factor this market.
              • ensuring data integrity is the driving factor this market.
              • facilitating adherence to multiple overlapping frameworks is the driving factor this market.
              • and providing the analytical depth needed for robust is the driving factor this market.
              • auditable disclosures. The financial and reputational risks associated with non-compliance are substantial is the driving factor this market.
              • compelling organizations to invest in technologies that can navigate this intricate regulatory web with precision and efficiency. AI algorithms excel at processing both structured and unstructured data is the driving factor this market.
              • from utility bills and emissions sensor readings to supplier contracts and policy documents is the driving factor this market.
              • harmonizing it into a cohesive dataset ready for analysis and reporting. This capability is critical as regulations now demand detailed reporting not just on a company direct operations but also across its entire value chain is the driving factor this market.
              • a task that is nearly impossible without advanced technological intervention. Several recent global developments underscore the profound impact of this regulatory driver. A landmark instance is the European Union Corporate Sustainability Reporting Directive (CSRD) is the driving factor this market.
              • which began its phased implementation for the 2024 reporting year. Affecting approximately 50 is the driving factor this market.
              • 000 companies is the driving factor this market.
              • including many non-EU parent companies with significant EU operations is the driving factor this market.
              • the CSRD introduces the concept of double materiality. This requires companies to report not only on how sustainability issues affect their business but also on how their business impacts society and the environment. The directive mandates disclosure across more than 1 is the driving factor this market.
              • 000 data points aligned with the European Sustainability Reporting Standards (ESRS). The immense scope of this requirement makes AI-driven platforms indispensable for identifying material topics is the driving factor this market.
              • collecting relevant data across global operations is the driving factor this market.
              • and ensuring the information is verifiable and assured. In March 2024 is the driving factor this market.
              • the United States Securities and Exchange Commission (SEC) finalized its long-awaited climate-related disclosure rule. This rule mandates that large public companies disclose their greenhouse gas emissions from direct operations (Scope 1) and energy consumption (Scope 2) is the driving factor this market.
              • detail the material climate-related risks they face is the driving factor this market.
              • and describe their strategies for managing those risks. The requirement for third-party assurance on emissions data creates a direct need for AI systems that can provide a clear is the driving factor this market.
              • auditable trail of data from source to final report is the driving factor this market.
              • minimizing human error and bolstering credibility. is the driving factor this market.

              The Ai In Esg And Sustainability market vendors should focus on grabbing business opportunities from the Cloud segment as it accounted for the largest market share in the base year.