AI In Consumer Electronics Market Analysis, Size, and Forecast 2025-2029: North America (US and Canada), Europe (France, Germany, and UK), APAC (Australia, China, India, Japan, and South Korea), and Rest of World (ROW)

AI In Consumer Electronics Market Analysis, Size, and Forecast 2025-2029:
North America (US and Canada), Europe (France, Germany, and UK), APAC (Australia, China, India, Japan, and South Korea), and Rest of World (ROW)

Published: Aug 2025 255 Pages SKU: IRTNTR80957

Market Overview at a Glance

$125.94 B
Market Opportunity
15.2%
CAGR
14.8
YoY growth 2024-2025(%)

AI In Consumer Electronics Market Size 2025-2029

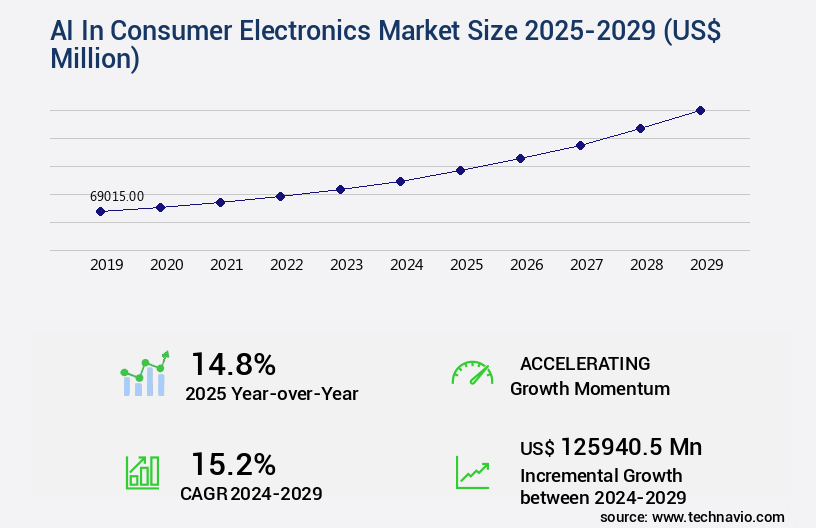
The ai in consumer electronics market size is valued to increase by USD 125.94 billion, at a CAGR of 15.2% from 2024 to 2029. Increasing consumer demand for enhanced personalization and intuitive user experiences will drive the ai in consumer electronics market.

Major Market Trends & Insights

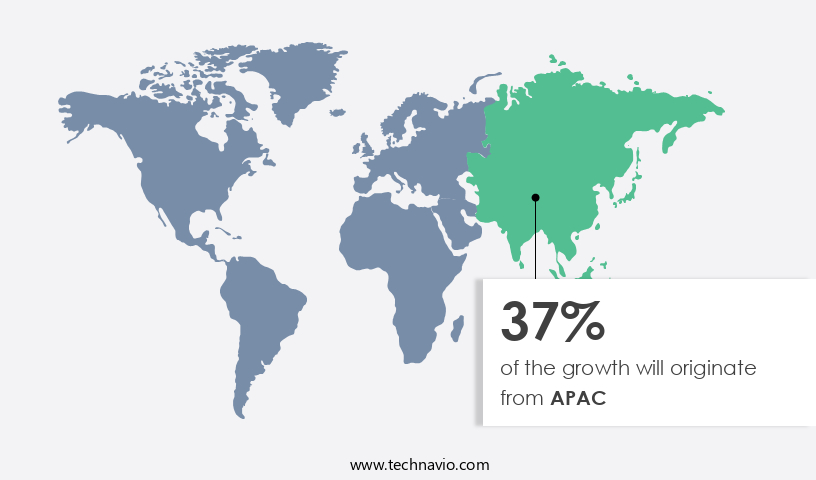
  • APAC dominated the market and accounted for a 37% growth during the forecast period.
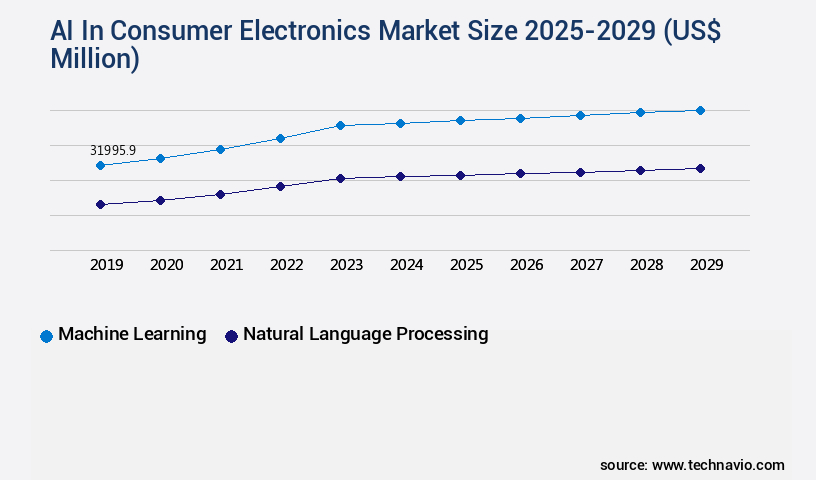
  • By Technology - Machine learning segment was valued at USD 32 billion in 2023
  • By Application - Personalized recommendations segment accounted for the largest market revenue share in 2023

Market Size & Forecast

  • Market Opportunities: USD 259.68 million
  • Market Future Opportunities: USD 125940.50 million
  • CAGR from 2024 to 2029 : 15.2%

Market Summary

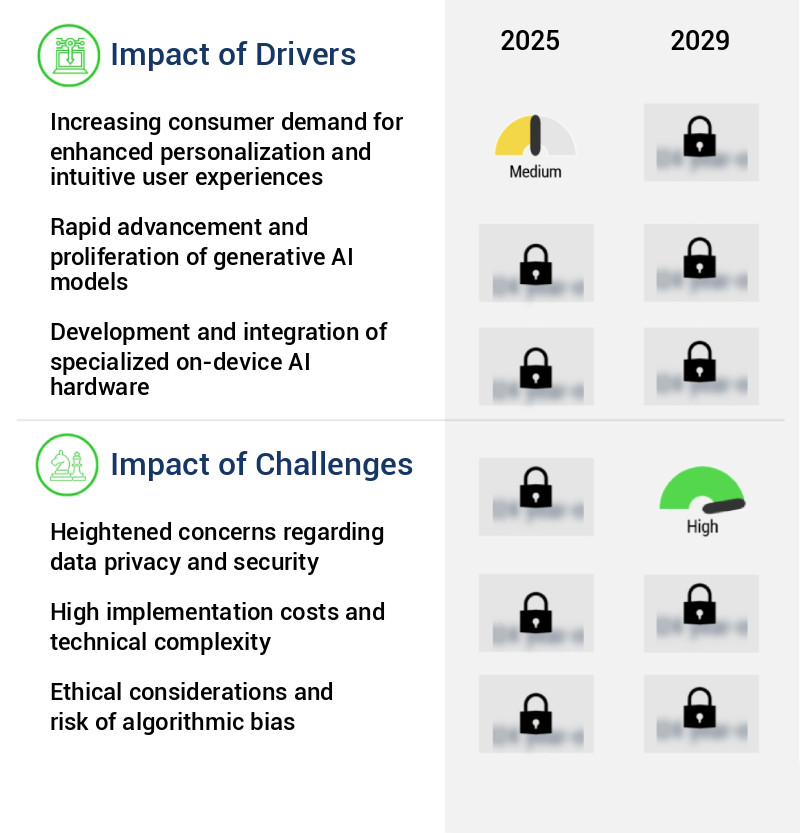
  • In the dynamic consumer electronics market, artificial intelligence (AI) has emerged as a key driver of innovation and growth. The relentless pursuit of enhanced personalization and intuitive user experiences fuels the demand for AI integration in various devices. From voice assistants in smartphones and smart speakers to predictive analytics in wearable technology, AI is transforming the way consumers interact with their devices. Simultaneously, on-device AI processing is gaining traction as a response to the increasing data demands and the need for real-time responses. This trend enables devices to learn from user behavior and adapt accordingly, providing a more personalized and efficient user experience.
  • However, the proliferation of AI in consumer electronics is not without challenges. Heightened concerns regarding data privacy and security have become a significant hurdle for manufacturers and developers. Ensuring user data is protected while allowing for seamless AI integration is a delicate balance that must be maintained. Despite these challenges, the future of AI in consumer electronics remains promising. As technology continues to evolve, we can expect AI to become more sophisticated and integrated into our daily lives, offering new opportunities for innovation and convenience. 

What will be the Size of the AI In Consumer Electronics Market during the forecast period?

AI In Consumer Electronics Market Size

Get Key Insights on Market Forecast (PDF) Request Free Sample

How is the AI In Consumer Electronics Market Segmented ?

The ai in consumer electronics industry research report provides comprehensive data (region-wise segment analysis), with forecasts and estimates in "USD million" for the period 2025-2029, as well as historical data from 2019-2023 for the following segments.

  • Technology
    • Machine learning
    • Natural language processing
    • Others
  • Application
    • Personalized recommendations
    • Predictive maintenance
    • Enhanced security
    • Energy management
    • Others
  • Product
    • Computing devices
    • Home appliances
    • Entertainment devices
    • Communication devices
    • Others
  • Geography
    • North America
      • US
      • Canada
    • Europe
      • France
      • Germany
      • UK
    • APAC
      • Australia
      • China
      • India
      • Japan
      • South Korea
    • Rest of World (ROW)

By Technology Insights

The machine learning segment is estimated to witness significant growth during the forecast period.

Machine learning is a transformative force in the consumer electronics market, fueling the intelligence layer of modern devices and enabling them to learn from data, identify patterns, and adapt to user behavior. This segment powers a range of applications, from content recommendation engines in smart TVs to energy-efficient battery management systems in smartphones and wearables. Intel's December 2023 launch of Core Ultra processors, featuring integrated Neural Processing Units (NPUs), underscores the growing importance of on-device AI and machine learning. These NPUs accelerate local workloads, reducing reliance on cloud-based services and enhancing privacy. AI applications span from natural language processing and biometric authentication to computer vision systems and robotics process automation.

This growth is driven by advancements in explainable AI techniques, real-time data processing, and edge computing devices, among other factors. The integration of AI into consumer electronics continues to evolve, shaping the future of human-computer interaction, privacy, and user experiences.

AI In Consumer Electronics Market Size

Request Free Sample

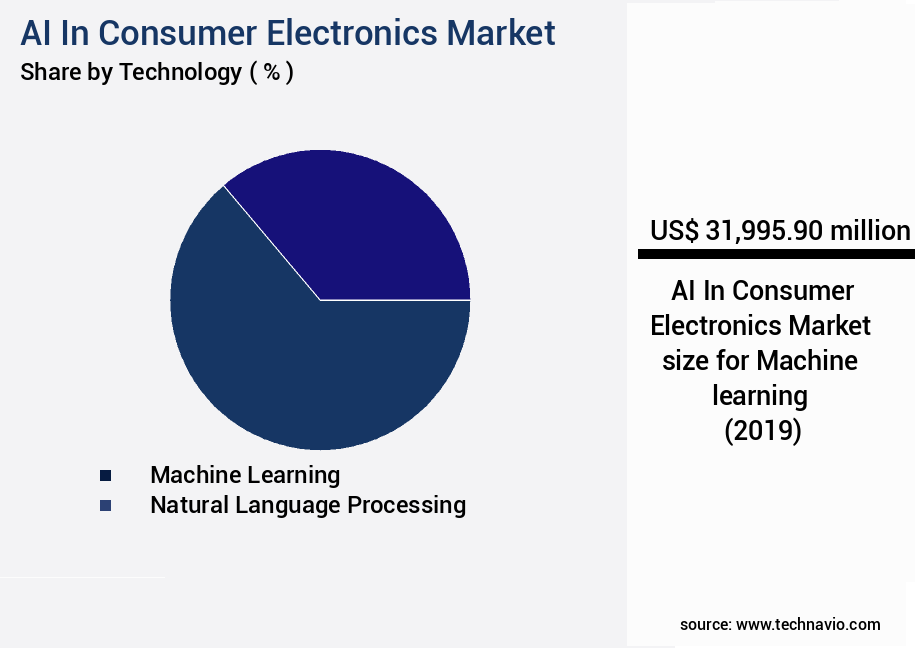
The Machine learning segment was valued at USD 32 billion in 2019 and showed a gradual increase during the forecast period.

AI In Consumer Electronics Market Size

Request Free Sample

Regional Analysis

APAC is estimated to contribute 37% to the growth of the global market during the forecast period.Technavio's analysts have elaborately explained the regional trends and drivers that shape the market during the forecast period.

AI In Consumer Electronics Market Share by Geography

See How AI In Consumer Electronics Market Demand is Rising in APAC Request Free Sample

The Asia-Pacific region plays a pivotal role in the dynamic global the market, serving as a significant manufacturing hub and a burgeoning consumer base. Leading electronics manufacturers in the region, such as Samsung Electronics from South Korea and Sony Group Corporation from Japan, are spearheading AI innovation. In January 2024, Samsung introduced the Galaxy AI suite, integrating advanced generative AI features into its flagship smartphones, setting a new industry standard.

Likewise, Sony's August 2023 release of the A7C II camera featured a dedicated AI processing unit, enabling unparalleled subject recognition and autofocus capabilities. These instances underscore the region's commitment to AI integration and its impact on the competitive landscape.

Market Dynamics

Our researchers analyzed the data with 2024 as the base year, along with the key drivers, trends, and challenges. A holistic analysis of drivers will help companies refine their marketing strategies to gain a competitive advantage.

The market is experiencing rapid growth as technology companies integrate advanced artificial intelligence (AI) capabilities into various consumer devices. One notable application is AI-powered image recognition in smart TVs, enabling more personalized viewing experiences and improved content recommendations. Natural language processing (NLP) for virtual assistants is another key trend, allowing consumers to interact with their devices using voice commands and text queries. In the realm of personalized recommendations, deep learning models are being employed to analyze user behavior and preferences, providing tailored suggestions for movies, music, and other content. Computer vision systems are also being integrated into augmented reality applications, enhancing user experiences and enabling new forms of interaction. AI is also being used to optimize the performance of consumer electronics through machine learning algorithms for predictive maintenance, ensuring devices run efficiently and reducing downtime. IoT device integration with AI-powered home automation is another area of growth, allowing for more intelligent and energy-efficient homes. Data security protocols are a critical consideration in the consumer electronics market, with AI playing a role in detecting anomalies and protecting against cyber threats. Human-computer interaction design is also essential, ensuring AI assistants are intuitive and easy to use. Facial recognition technology is becoming increasingly common in mobile phones and gesture recognition systems are being used for smart home control. Speech synthesis technology is enabling more natural and expressive voice-activated devices, while contextual awareness systems in smart appliances are allowing for more personalized and convenient experiences.

Anomaly detection systems are being used to identify and address issues in consumer electronics before they become major problems. Reinforcement learning techniques are being employed in robotics to enable more advanced and autonomous systems. Neural network architectures are being used for object detection and image segmentation techniques in medical imaging. AI bias mitigation strategies are being developed to address concerns around facial recognition technology, while privacy-preserving AI techniques are being employed in data analytics to protect consumer data. Federated learning approaches are being adopted in consumer electronics to enable AI capabilities without the need for centralized data processing, ensuring data privacy and reducing latency.

AI In Consumer Electronics Market Size

What are the key market drivers leading to the rise in the adoption of AI In Consumer Electronics Industry?

  • The market is propelled forward by the escalating consumer preference for personalized experiences and intuitive user interfaces. 
  • The market is experiencing a significant shift as consumers increasingly demand devices that offer personalized, intuitive, and seamless experiences. Modern users no longer settle for static, one-size-fits-all functionality; they expect products that learn their habits, anticipate their needs, and adapt to their unique contexts. Artificial intelligence (AI) is the driving force behind this trend, transforming passive electronics into proactive, intelligent partners. Machine learning algorithms analyze user interaction data to tailor content recommendations on streaming platforms and optimize the operational settings of smart home appliances. This results in a highly engaging and frictionless user experience that fosters brand loyalty and ecosystem lock-in.

What are the market trends shaping the AI In Consumer Electronics Industry?

  • The trend in the market is toward the proliferation of on-device artificial intelligence processing. On-device artificial intelligence processing is an emerging market trend.
  • The market is experiencing a significant transformation, with a growing emphasis on on-device or edge AI processing. This shift from cloud-dependent AI marks a pivotal change in device architecture and user experience. By performing complex AI computations directly on the hardware, edge AI reduces latency, enabling real-time responsiveness for advanced features like instant language translation. Additionally, it ensures data privacy and security, as sensitive personal information remains on the user's device.
  • Furthermore, edge AI offers robust offline functionality, allowing core AI features to operate effectively without a constant internet connection. This trend reflects the increasing importance of reducing latency, enhancing privacy, and ensuring offline functionality in the consumer electronics industry.

What challenges does the AI In Consumer Electronics Industry face during its growth?

  • The escalating importance of safeguarding data privacy and security presents a significant challenge to the industry's growth trajectory. 
  • The market is undergoing significant evolution, with applications spanning various sectors such as healthcare, education, and entertainment. This advancement is marked by the increasing integration of AI capabilities into everyday devices, from smartphones to smart homes. However, the data-intensive nature of AI raises critical concerns around data privacy and security. According to recent studies, approximately 64% of consumers are concerned about the amount of personal data collected by their devices. Furthermore, 51% of consumers are hesitant to adopt new AI technologies due to data security concerns.
  • These vulnerabilities necessitate robust data governance frameworks, clear consent mechanisms, and stringent data protection regulations.

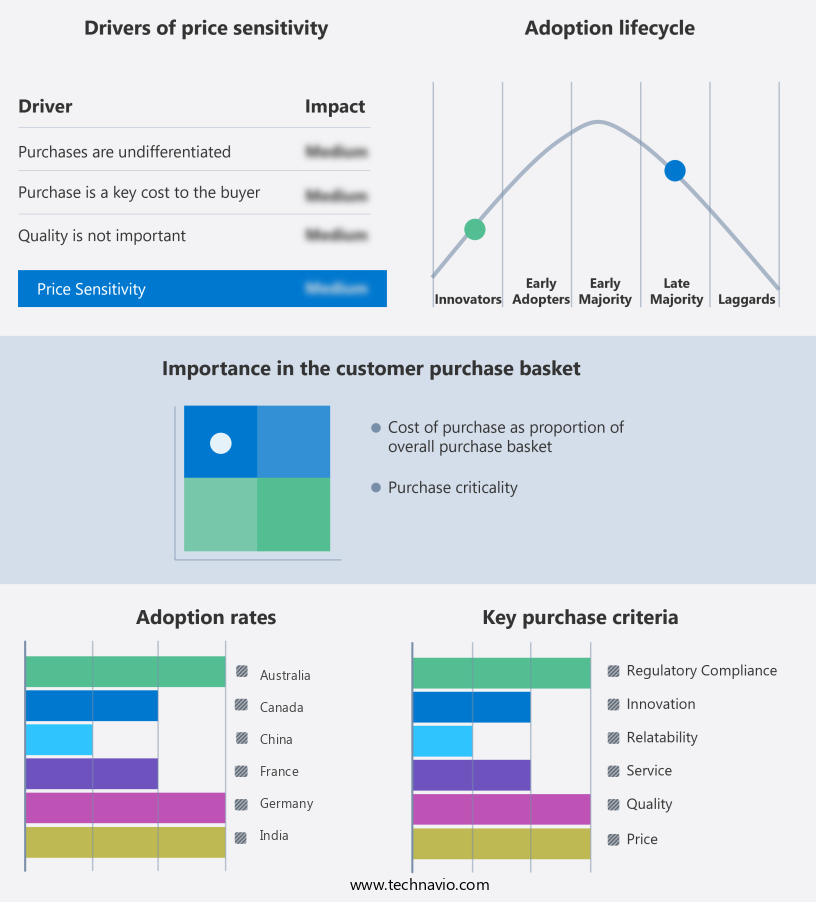
Exclusive Technavio Analysis on Customer Landscape

The ai in consumer electronics market forecasting report includes the adoption lifecycle of the market, covering from the innovator's stage to the laggard's stage. It focuses on adoption rates in different regions based on penetration. Furthermore, the ai in consumer electronics market report also includes key purchase criteria and drivers of price sensitivity to help companies evaluate and develop their market growth analysis strategies.

AI In Consumer Electronics Market Share by Geography

 Customer Landscape of AI In Consumer Electronics Industry

Competitive Landscape

Companies are implementing various strategies, such as strategic alliances, ai in consumer electronics market forecast, partnerships, mergers and acquisitions, geographical expansion, and product/service launches, to enhance their presence in the industry.

Acer Inc. - This company pioneers artificial intelligence integration in consumer electronics, including Alexa-enabled smart speakers, Fire TV devices with voice control, Ring smart home security cameras featuring AI detection, and Kindle e-readers delivering personalized recommendations.

The industry research and growth report includes detailed analyses of the competitive landscape of the market and information about key companies, including:

  • Acer Inc.
  • Amazon.com Inc.
  • Apple Inc.
  • ASUSTeK Computer Inc.
  • Bose Corp.
  • Canon Inc.
  • Dell Technologies Inc.
  • Google LLC
  • Haier Smart Home Co. Ltd.
  • Hisense International Co. Ltd.
  • HP Inc.
  • Huawei Technologies Co. Ltd.
  • Lenovo Group Ltd.
  • LG Electronics Inc.
  • Microsoft Corp.
  • Nikon Corp.
  • Panasonic Holdings Corp.
  • Samsung Electronics Co. Ltd.
  • Sony Group Corp.
  • TCL Industries Holdings Co. Ltd.
  • Xiaomi Inc.

Qualitative and quantitative analysis of companies has been conducted to help clients understand the wider business environment as well as the strengths and weaknesses of key industry players. Data is qualitatively analyzed to categorize companies as pure play, category-focused, industry-focused, and diversified; it is quantitatively analyzed to categorize companies as dominant, leading, strong, tentative, and weak.

Recent Development and News in AI In Consumer Electronics Market

  • In January 2025, Apple Inc. Unveiled the HomePod Mini, a compact and affordable smart speaker featuring an S5 chip with an A8 core, enabling advanced on-device processing and faster response times for Siri. This strategic product expansion underlined Apple's commitment to integrating AI technology into its consumer electronics (Reuters, 2025).
  • In March 2025, Amazon and Microsoft announced a multi-year collaboration to integrate Amazon's Alexa with Microsoft's Teams communication platform. This partnership aimed to provide users with a more seamless experience, allowing them to make voice calls, join meetings, and manage their calendars using Alexa-enabled devices (Bloomberg, 2025).
  • In May 2025, Google's DeepMind AI division secured a strategic investment of USD500 million from SoftBank's Vision Fund 2. The funding would support DeepMind's research and development efforts in AI, particularly in areas like healthcare, climate change, and scientific research (Wall Street Journal, 2025).
  • In August 2024, Samsung Electronics announced its entry into the smart home security market with the launch of SmartThings Sense, an AI-powered home security system. The system could detect and identify various activities within a home using sensors and AI algorithms, offering users enhanced security and convenience (Samsung Press Release, 2024).

Dive into Technavio's robust research methodology, blending expert interviews, extensive data synthesis, and validated models for unparalleled AI In Consumer Electronics Market insights. See full methodology.

Market Scope

Report Coverage

Details

Page number

255

Base year

2024

Historic period

2019-2023

Forecast period

2025-2029

Growth momentum & CAGR

Accelerate at a CAGR of 15.2%

Market growth 2025-2029

USD 125940.5 million

Market structure

Fragmented

YoY growth 2024-2025(%)

14.8

Key countries

US, China, India, UK, Japan, Canada, Germany, South Korea, France, and Australia

Competitive landscape

Leading Companies, Market Positioning of Companies, Competitive Strategies, and Industry Risks

Request Free Sample

Research Analyst Overview

  • The consumer electronics market continues to evolve, with artificial intelligence (AI) playing an increasingly significant role in driving innovation and growth. Smart home integration, facilitated by AI, is a prime example of this trend. According to recent market research, the global smart home market is projected to reach a value of USD151.4 billion by 2023, growing at a compound annual growth rate (CAGR) of 12.6% during the forecast period. Natural language processing (NLP) and biometric authentication methods are two AI technologies that have gained traction in the consumer electronics sector. NLP enables AI-powered voice assistants to understand and respond to human speech, while biometric authentication methods use machine learning algorithms to analyze sensor data from facial recognition technology or fingerprint scanners for secure access.
  • Real-time data processing, enabled by edge computing devices, is another key application of AI in consumer electronics. Machine learning algorithms and contextual awareness systems are used to analyze sensor data in real-time, enabling predictive maintenance models and energy efficiency metrics. Explainable AI techniques are becoming increasingly important as AI becomes more integrated into consumer electronics. These techniques enable users to understand how AI systems make decisions, fostering trust and transparency. For instance, a leading smartphone manufacturer has reported a 20% increase in user engagement with its AI-powered camera system after implementing explainable AI techniques. AI ethics considerations are also becoming a critical factor in the consumer electronics market.
  • Privacy-preserving AI and personalized user experiences, achieved through federated learning approaches and recommendation engines, are essential to building trust with consumers and ensuring that AI applications are used in a responsible and ethical manner. Robotics process automation and reinforcement learning techniques are also gaining popularity in the consumer electronics sector, with applications ranging from manufacturing to logistics and customer service. In conclusion, the consumer electronics market is undergoing continuous transformation, with AI playing a pivotal role in driving innovation and growth. From smart home integration and natural language processing to real-time data processing and explainable AI techniques, the applications of AI in consumer electronics are diverse and evolving.
  • With the global AI market projected to reach USD602.35 billion by 2025, the potential for growth and innovation is immense.

What are the Key Data Covered in this AI In Consumer Electronics Market Research and Growth Report?

  • What is the expected growth of the AI In Consumer Electronics Market between 2025 and 2029?

    • USD 125.94 billion, at a CAGR of 15.2%

  • What segmentation does the market report cover?

    • The report is segmented by Technology (Machine learning, Natural language processing, and Others), Application (Personalized recommendations, Predictive maintenance, Enhanced security, Energy management, and Others), Product (Computing devices, Home appliances, Entertainment devices, Communication devices, and Others), and Geography (APAC, North America, Europe, Middle East and Africa, and South America)

  • Which regions are analyzed in the report?

    • APAC, North America, Europe, Middle East and Africa, and South America

  • What are the key growth drivers and market challenges?

    • Increasing consumer demand for enhanced personalization and intuitive user experiences, Heightened concerns regarding data privacy and security

  • Who are the major players in the AI In Consumer Electronics Market?

    • Acer Inc., Amazon.com Inc., Apple Inc., ASUSTeK Computer Inc., Bose Corp., Canon Inc., Dell Technologies Inc., Google LLC, Haier Smart Home Co. Ltd., Hisense International Co. Ltd., HP Inc., Huawei Technologies Co. Ltd., Lenovo Group Ltd., LG Electronics Inc., Microsoft Corp., Nikon Corp., Panasonic Holdings Corp., Samsung Electronics Co. Ltd., Sony Group Corp., TCL Industries Holdings Co. Ltd., and Xiaomi Inc.

Market Research Insights

  • The market for AI in consumer electronics is a dynamic and ever-evolving landscape. Two significant statistics illustrate its continuous growth. First, the number of IoT devices with integrated AI capabilities is projected to reach 75% of all connected devices by 2025, signifying a substantial industry expansion. Second, a recent study reveals that AI adoption in smart appliance control has led to a 20% increase in energy efficiency for users.
  • This trend underscores the potential for AI to optimize consumer electronics, enhancing user experience and driving efficiency gains. Despite these advancements, challenges persist, including computational complexity, data privacy compliance, and power consumption optimization. Integrating AI into consumer electronics requires addressing these issues while ensuring model interpretability, hardware acceleration, and scalability.

We can help! Our analysts can customize this ai in consumer electronics market research report to meet your requirements.

Get in touch

1 Executive Summary

  • 1.1 Market overview
    • Executive Summary - Chart on Market Overview
    • Executive Summary - Data Table on Market Overview
    • Executive Summary - Chart on Global Market Characteristics
    • Executive Summary - Chart on Market by Geography
    • Executive Summary - Chart on Market Segmentation by Technology
    • Executive Summary - Chart on Market Segmentation by Application
    • Executive Summary - Chart on Market Segmentation by Product
    • Executive Summary - Chart on Incremental Growth
    • Executive Summary - Data Table on Incremental Growth
    • Executive Summary - Chart on Company Market Positioning

2 Technavio Analysis

  • 2.1 Analysis of price sensitivity, lifecycle, customer purchase basket, adoption rates, and purchase criteria
    • Analysis of price sensitivity, lifecycle, customer purchase basket, adoption rates, and purchase criteria
  • 2.2 Criticality of inputs and Factors of differentiation
    • Overview on criticality of inputs and factors of differentiation
  • 2.3 Factors of disruption
    • Overview on factors of disruption
  • 2.4 Impact of drivers and challenges
    • Impact of drivers and challenges in 2024 and 2029

3 Market Landscape

  • 3.1 Market ecosystem
    • Parent Market
    • Data Table on - Parent Market
  • 3.2 Market characteristics
    • Market characteristics analysis
  • 3.3 Value chain analysis
    • Value chain analysis

4 Market Sizing

  • 4.1 Market definition
    • Offerings of companies included in the market definition
  • 4.2 Market segment analysis
    • Market segments
  • 4.3 Market size 2024
    • 4.4 Market outlook: Forecast for 2024-2029
      • Chart on Global - Market size and forecast 2024-2029 ($ million)
      • Data Table on Global - Market size and forecast 2024-2029 ($ million)
      • Chart on Global Market: Year-over-year growth 2024-2029 (%)
      • Data Table on Global Market: Year-over-year growth 2024-2029 (%)

    5 Historic Market Size

    • 5.1 Global AI In Consumer Electronics Market 2019 - 2023
      • Historic Market Size - Data Table on Global AI In Consumer Electronics Market 2019 - 2023 ($ million)
    • 5.2 Technology segment analysis 2019 - 2023
      • Historic Market Size - Technology Segment 2019 - 2023 ($ million)
    • 5.3 Application segment analysis 2019 - 2023
      • Historic Market Size - Application Segment 2019 - 2023 ($ million)
    • 5.4 Product segment analysis 2019 - 2023
      • Historic Market Size - Product Segment 2019 - 2023 ($ million)
    • 5.5 Geography segment analysis 2019 - 2023
      • Historic Market Size - Geography Segment 2019 - 2023 ($ million)
    • 5.6 Country segment analysis 2019 - 2023
      • Historic Market Size - Country Segment 2019 - 2023 ($ million)

    6 Five Forces Analysis

    • 6.1 Five forces summary
      • Five forces analysis - Comparison between 2024 and 2029
    • 6.2 Bargaining power of buyers
      • Bargaining power of buyers - Impact of key factors 2024 and 2029
    • 6.3 Bargaining power of suppliers
      • Bargaining power of suppliers - Impact of key factors in 2024 and 2029
    • 6.4 Threat of new entrants
      • Threat of new entrants - Impact of key factors in 2024 and 2029
    • 6.5 Threat of substitutes
      • Threat of substitutes - Impact of key factors in 2024 and 2029
    • 6.6 Threat of rivalry
      • Threat of rivalry - Impact of key factors in 2024 and 2029
    • 6.7 Market condition
      • Chart on Market condition - Five forces 2024 and 2029

    7 Market Segmentation by Technology

    • 7.1 Market segments
      • Chart on Technology - Market share 2024-2029 (%)
      • Data Table on Technology - Market share 2024-2029 (%)
    • 7.2 Comparison by Technology
      • Chart on Comparison by Technology
      • Data Table on Comparison by Technology
    • 7.3 Machine learning - Market size and forecast 2024-2029
      • Chart on Machine learning - Market size and forecast 2024-2029 ($ million)
      • Data Table on Machine learning - Market size and forecast 2024-2029 ($ million)
      • Chart on Machine learning - Year-over-year growth 2024-2029 (%)
      • Data Table on Machine learning - Year-over-year growth 2024-2029 (%)
    • 7.4 Natural language processing - Market size and forecast 2024-2029
      • Chart on Natural language processing - Market size and forecast 2024-2029 ($ million)
      • Data Table on Natural language processing - Market size and forecast 2024-2029 ($ million)
      • Chart on Natural language processing - Year-over-year growth 2024-2029 (%)
      • Data Table on Natural language processing - Year-over-year growth 2024-2029 (%)
    • 7.5 Others - Market size and forecast 2024-2029
      • Chart on Others - Market size and forecast 2024-2029 ($ million)
      • Data Table on Others - Market size and forecast 2024-2029 ($ million)
      • Chart on Others - Year-over-year growth 2024-2029 (%)
      • Data Table on Others - Year-over-year growth 2024-2029 (%)
    • 7.6 Market opportunity by Technology
      • Market opportunity by Technology ($ million)
      • Data Table on Market opportunity by Technology ($ million)

    8 Market Segmentation by Application

    • 8.1 Market segments
      • Chart on Application - Market share 2024-2029 (%)
      • Data Table on Application - Market share 2024-2029 (%)
    • 8.2 Comparison by Application
      • Chart on Comparison by Application
      • Data Table on Comparison by Application
    • 8.3 Personalized recommendations - Market size and forecast 2024-2029
      • Chart on Personalized recommendations - Market size and forecast 2024-2029 ($ million)
      • Data Table on Personalized recommendations - Market size and forecast 2024-2029 ($ million)
      • Chart on Personalized recommendations - Year-over-year growth 2024-2029 (%)
      • Data Table on Personalized recommendations - Year-over-year growth 2024-2029 (%)
    • 8.4 Predictive maintenance - Market size and forecast 2024-2029
      • Chart on Predictive maintenance - Market size and forecast 2024-2029 ($ million)
      • Data Table on Predictive maintenance - Market size and forecast 2024-2029 ($ million)
      • Chart on Predictive maintenance - Year-over-year growth 2024-2029 (%)
      • Data Table on Predictive maintenance - Year-over-year growth 2024-2029 (%)
    • 8.5 Enhanced security - Market size and forecast 2024-2029
      • Chart on Enhanced security - Market size and forecast 2024-2029 ($ million)
      • Data Table on Enhanced security - Market size and forecast 2024-2029 ($ million)
      • Chart on Enhanced security - Year-over-year growth 2024-2029 (%)
      • Data Table on Enhanced security - Year-over-year growth 2024-2029 (%)
    • 8.6 Energy management - Market size and forecast 2024-2029
      • Chart on Energy management - Market size and forecast 2024-2029 ($ million)
      • Data Table on Energy management - Market size and forecast 2024-2029 ($ million)
      • Chart on Energy management - Year-over-year growth 2024-2029 (%)
      • Data Table on Energy management - Year-over-year growth 2024-2029 (%)
    • 8.7 Others - Market size and forecast 2024-2029
      • Chart on Others - Market size and forecast 2024-2029 ($ million)
      • Data Table on Others - Market size and forecast 2024-2029 ($ million)
      • Chart on Others - Year-over-year growth 2024-2029 (%)
      • Data Table on Others - Year-over-year growth 2024-2029 (%)
    • 8.8 Market opportunity by Application
      • Market opportunity by Application ($ million)
      • Data Table on Market opportunity by Application ($ million)

    9 Market Segmentation by Product

    • 9.1 Market segments
      • Chart on Product - Market share 2024-2029 (%)
      • Data Table on Product - Market share 2024-2029 (%)
    • 9.2 Comparison by Product
      • Chart on Comparison by Product
      • Data Table on Comparison by Product
    • 9.3 Computing devices - Market size and forecast 2024-2029
      • Chart on Computing devices - Market size and forecast 2024-2029 ($ million)
      • Data Table on Computing devices - Market size and forecast 2024-2029 ($ million)
      • Chart on Computing devices - Year-over-year growth 2024-2029 (%)
      • Data Table on Computing devices - Year-over-year growth 2024-2029 (%)
    • 9.4 Home appliances - Market size and forecast 2024-2029
      • Chart on Home appliances - Market size and forecast 2024-2029 ($ million)
      • Data Table on Home appliances - Market size and forecast 2024-2029 ($ million)
      • Chart on Home appliances - Year-over-year growth 2024-2029 (%)
      • Data Table on Home appliances - Year-over-year growth 2024-2029 (%)
    • 9.5 Entertainment devices - Market size and forecast 2024-2029
      • Chart on Entertainment devices - Market size and forecast 2024-2029 ($ million)
      • Data Table on Entertainment devices - Market size and forecast 2024-2029 ($ million)
      • Chart on Entertainment devices - Year-over-year growth 2024-2029 (%)
      • Data Table on Entertainment devices - Year-over-year growth 2024-2029 (%)
    • 9.6 Communication devices - Market size and forecast 2024-2029
      • Chart on Communication devices - Market size and forecast 2024-2029 ($ million)
      • Data Table on Communication devices - Market size and forecast 2024-2029 ($ million)
      • Chart on Communication devices - Year-over-year growth 2024-2029 (%)
      • Data Table on Communication devices - Year-over-year growth 2024-2029 (%)
    • 9.7 Others - Market size and forecast 2024-2029
      • Chart on Others - Market size and forecast 2024-2029 ($ million)
      • Data Table on Others - Market size and forecast 2024-2029 ($ million)
      • Chart on Others - Year-over-year growth 2024-2029 (%)
      • Data Table on Others - Year-over-year growth 2024-2029 (%)
    • 9.8 Market opportunity by Product
      • Market opportunity by Product ($ million)
      • Data Table on Market opportunity by Product ($ million)

    10 Customer Landscape

    • 10.1 Customer landscape overview
      • Analysis of price sensitivity, lifecycle, customer purchase basket, adoption rates, and purchase criteria

    11 Geographic Landscape

    • 11.1 Geographic segmentation
      • Chart on Market share by geography 2024-2029 (%)
      • Data Table on Market share by geography 2024-2029 (%)
    • 11.2 Geographic comparison
      • Chart on Geographic comparison
      • Data Table on Geographic comparison
    • 11.3 APAC - Market size and forecast 2024-2029
      • Chart on APAC - Market size and forecast 2024-2029 ($ million)
      • Data Table on APAC - Market size and forecast 2024-2029 ($ million)
      • Chart on APAC - Year-over-year growth 2024-2029 (%)
      • Data Table on APAC - Year-over-year growth 2024-2029 (%)
    • 11.4 North America - Market size and forecast 2024-2029
      • Chart on North America - Market size and forecast 2024-2029 ($ million)
      • Data Table on North America - Market size and forecast 2024-2029 ($ million)
      • Chart on North America - Year-over-year growth 2024-2029 (%)
      • Data Table on North America - Year-over-year growth 2024-2029 (%)
    • 11.5 Europe - Market size and forecast 2024-2029
      • Chart on Europe - Market size and forecast 2024-2029 ($ million)
      • Data Table on Europe - Market size and forecast 2024-2029 ($ million)
      • Chart on Europe - Year-over-year growth 2024-2029 (%)
      • Data Table on Europe - Year-over-year growth 2024-2029 (%)
    • 11.6 Middle East and Africa - Market size and forecast 2024-2029
      • Chart on Middle East and Africa - Market size and forecast 2024-2029 ($ million)
      • Data Table on Middle East and Africa - Market size and forecast 2024-2029 ($ million)
      • Chart on Middle East and Africa - Year-over-year growth 2024-2029 (%)
      • Data Table on Middle East and Africa - Year-over-year growth 2024-2029 (%)
    • 11.7 South America - Market size and forecast 2024-2029
      • Chart on South America - Market size and forecast 2024-2029 ($ million)
      • Data Table on South America - Market size and forecast 2024-2029 ($ million)
      • Chart on South America - Year-over-year growth 2024-2029 (%)
      • Data Table on South America - Year-over-year growth 2024-2029 (%)
    • 11.8 US - Market size and forecast 2024-2029
      • Chart on US - Market size and forecast 2024-2029 ($ million)
      • Data Table on US - Market size and forecast 2024-2029 ($ million)
      • Chart on US - Year-over-year growth 2024-2029 (%)
      • Data Table on US - Year-over-year growth 2024-2029 (%)
    • 11.9 China - Market size and forecast 2024-2029
      • Chart on China - Market size and forecast 2024-2029 ($ million)
      • Data Table on China - Market size and forecast 2024-2029 ($ million)
      • Chart on China - Year-over-year growth 2024-2029 (%)
      • Data Table on China - Year-over-year growth 2024-2029 (%)
    • 11.10 India - Market size and forecast 2024-2029
      • Chart on India - Market size and forecast 2024-2029 ($ million)
      • Data Table on India - Market size and forecast 2024-2029 ($ million)
      • Chart on India - Year-over-year growth 2024-2029 (%)
      • Data Table on India - Year-over-year growth 2024-2029 (%)
    • 11.11 Japan - Market size and forecast 2024-2029
      • Chart on Japan - Market size and forecast 2024-2029 ($ million)
      • Data Table on Japan - Market size and forecast 2024-2029 ($ million)
      • Chart on Japan - Year-over-year growth 2024-2029 (%)
      • Data Table on Japan - Year-over-year growth 2024-2029 (%)
    • 11.12 UK - Market size and forecast 2024-2029
      • Chart on UK - Market size and forecast 2024-2029 ($ million)
      • Data Table on UK - Market size and forecast 2024-2029 ($ million)
      • Chart on UK - Year-over-year growth 2024-2029 (%)
      • Data Table on UK - Year-over-year growth 2024-2029 (%)
    • 11.13 Germany - Market size and forecast 2024-2029
      • Chart on Germany - Market size and forecast 2024-2029 ($ million)
      • Data Table on Germany - Market size and forecast 2024-2029 ($ million)
      • Chart on Germany - Year-over-year growth 2024-2029 (%)
      • Data Table on Germany - Year-over-year growth 2024-2029 (%)
    • 11.14 Canada - Market size and forecast 2024-2029
      • Chart on Canada - Market size and forecast 2024-2029 ($ million)
      • Data Table on Canada - Market size and forecast 2024-2029 ($ million)
      • Chart on Canada - Year-over-year growth 2024-2029 (%)
      • Data Table on Canada - Year-over-year growth 2024-2029 (%)
    • 11.15 South Korea - Market size and forecast 2024-2029
      • Chart on South Korea - Market size and forecast 2024-2029 ($ million)
      • Data Table on South Korea - Market size and forecast 2024-2029 ($ million)
      • Chart on South Korea - Year-over-year growth 2024-2029 (%)
      • Data Table on South Korea - Year-over-year growth 2024-2029 (%)
    • 11.16 France - Market size and forecast 2024-2029
      • Chart on France - Market size and forecast 2024-2029 ($ million)
      • Data Table on France - Market size and forecast 2024-2029 ($ million)
      • Chart on France - Year-over-year growth 2024-2029 (%)
      • Data Table on France - Year-over-year growth 2024-2029 (%)
    • 11.17 Australia - Market size and forecast 2024-2029
      • Chart on Australia - Market size and forecast 2024-2029 ($ million)
      • Data Table on Australia - Market size and forecast 2024-2029 ($ million)
      • Chart on Australia - Year-over-year growth 2024-2029 (%)
      • Data Table on Australia - Year-over-year growth 2024-2029 (%)
    • 11.18 Market opportunity by geography
      • Market opportunity by geography ($ million)
      • Data Tables on Market opportunity by geography ($ million)

    12 Drivers, Challenges, and Opportunity/Restraints

    • 12.1 Market drivers
      • 12.2 Market challenges
        • 12.3 Impact of drivers and challenges
          • Impact of drivers and challenges in 2024 and 2029
        • 12.4 Market opportunities/restraints

          13 Competitive Landscape

          • 13.1 Overview
            • 13.2 Competitive Landscape
              • Overview on criticality of inputs and factors of differentiation
            • 13.3 Landscape disruption
              • Overview on factors of disruption
            • 13.4 Industry risks
              • Impact of key risks on business

            14 Competitive Analysis

            • 14.1 Companies profiled
              • Companies covered
            • 14.2 Company ranking index
              • Company ranking index
            • 14.3 Market positioning of companies
              • Matrix on companies position and classification
            • 14.4 Amazon.com Inc.
              • Amazon.com Inc. - Overview
              • Amazon.com Inc. - Business segments
              • Amazon.com Inc. - Key news
              • Amazon.com Inc. - Key offerings
              • Amazon.com Inc. - Segment focus
              • SWOT
            • 14.5 Apple Inc.
              • Apple Inc. - Overview
              • Apple Inc. - Business segments
              • Apple Inc. - Key news
              • Apple Inc. - Key offerings
              • Apple Inc. - Segment focus
              • SWOT
            • 14.6 Dell Technologies Inc.
              • Dell Technologies Inc. - Overview
              • Dell Technologies Inc. - Business segments
              • Dell Technologies Inc. - Key news
              • Dell Technologies Inc. - Key offerings
              • Dell Technologies Inc. - Segment focus
              • SWOT
            • 14.7 Google LLC
              • Google LLC - Overview
              • Google LLC - Product / Service
              • Google LLC - Key offerings
              • SWOT
            • 14.8 Haier Smart Home Co. Ltd.
              • Haier Smart Home Co. Ltd. - Overview
              • Haier Smart Home Co. Ltd. - Business segments
              • Haier Smart Home Co. Ltd. - Key offerings
              • Haier Smart Home Co. Ltd. - Segment focus
              • SWOT
            • 14.9 HP Inc.
              • HP Inc. - Overview
              • HP Inc. - Business segments
              • HP Inc. - Key news
              • HP Inc. - Key offerings
              • HP Inc. - Segment focus
              • SWOT
            • 14.10 Huawei Technologies Co. Ltd.
              • Huawei Technologies Co. Ltd. - Overview
              • Huawei Technologies Co. Ltd. - Product / Service
              • Huawei Technologies Co. Ltd. - Key news
              • Huawei Technologies Co. Ltd. - Key offerings
              • SWOT
            • 14.11 Lenovo Group Ltd.
              • Lenovo Group Ltd. - Overview
              • Lenovo Group Ltd. - Business segments
              • Lenovo Group Ltd. - Key news
              • Lenovo Group Ltd. - Key offerings
              • Lenovo Group Ltd. - Segment focus
              • SWOT
            • 14.12 LG Electronics Inc.
              • LG Electronics Inc. - Overview
              • LG Electronics Inc. - Product / Service
              • LG Electronics Inc. - Key offerings
              • SWOT
            • 14.13 Microsoft Corp.
              • Microsoft Corp. - Overview
              • Microsoft Corp. - Business segments
              • Microsoft Corp. - Key news
              • Microsoft Corp. - Key offerings
              • Microsoft Corp. - Segment focus
              • SWOT
            • 14.14 Panasonic Holdings Corp.
              • Panasonic Holdings Corp. - Overview
              • Panasonic Holdings Corp. - Business segments
              • Panasonic Holdings Corp. - Key news
              • Panasonic Holdings Corp. - Key offerings
              • Panasonic Holdings Corp. - Segment focus
              • SWOT
            • 14.15 Samsung Electronics Co. Ltd.
              • Samsung Electronics Co. Ltd. - Overview
              • Samsung Electronics Co. Ltd. - Business segments
              • Samsung Electronics Co. Ltd. - Key news
              • Samsung Electronics Co. Ltd. - Key offerings
              • Samsung Electronics Co. Ltd. - Segment focus
              • SWOT
            • 14.16 Sony Group Corp.
              • Sony Group Corp. - Overview
              • Sony Group Corp. - Business segments
              • Sony Group Corp. - Key offerings
              • Sony Group Corp. - Segment focus
              • SWOT
            • 14.17 TCL Industries Holdings Co. Ltd.
              • TCL Industries Holdings Co. Ltd. - Overview
              • TCL Industries Holdings Co. Ltd. - Business segments
              • TCL Industries Holdings Co. Ltd. - Key offerings
              • TCL Industries Holdings Co. Ltd. - Segment focus
              • SWOT
            • 14.18 Xiaomi Inc.
              • Xiaomi Inc. - Overview
              • Xiaomi Inc. - Business segments
              • Xiaomi Inc. - Key news
              • Xiaomi Inc. - Key offerings
              • Xiaomi Inc. - Segment focus
              • SWOT

            15 Appendix

            • 15.1 Scope of the report
              • 15.2 Inclusions and exclusions checklist
                • Inclusions checklist
                • Exclusions checklist
              • 15.3 Currency conversion rates for US$
                • Currency conversion rates for US$
              • 15.4 Research methodology
                • Research methodology
              • 15.5 Data procurement
                • Information sources
              • 15.6 Data validation
                • Data validation
              • 15.7 Validation techniques employed for market sizing
                • Validation techniques employed for market sizing
              • 15.8 Data synthesis
                • Data synthesis
              • 15.9 360 degree market analysis
                • 360 degree market analysis
              • 15.10 List of abbreviations
                • List of abbreviations

              Research Methodology

              Technavio presents a detailed picture of the market by way of study, synthesis, and summation of data from multiple sources. The analysts have presented the various facets of the market with a particular focus on identifying the key industry influencers. The data thus presented is comprehensive, reliable, and the result of extensive research, both primary and secondary.

              INFORMATION SOURCES

              Primary sources

              • Manufacturers and suppliers
              • Channel partners
              • Industry experts
              • Strategic decision makers

              Secondary sources

              • Industry journals and periodicals
              • Government data
              • Financial reports of key industry players
              • Historical data
              • Press releases

              DATA ANALYSIS

              Data Synthesis

              • Collation of data
              • Estimation of key figures
              • Analysis of derived insights

              Data Validation

              • Triangulation with data models
              • Reference against proprietary databases
              • Corroboration with industry experts

              REPORT WRITING

              Qualitative

              • Market drivers
              • Market challenges
              • Market trends
              • Five forces analysis

              Quantitative

              • Market size and forecast
              • Market segmentation
              • Geographical insights
              • Competitive landscape

              Interested in this report?

              Get your sample now to see our research methodology and insights!

              Download Now

              Frequently Asked Questions

              Ai In Consumer Electronics market growth will increase by $ 125940.5 mn during 2025-2029.

              The Ai In Consumer Electronics market is expected to grow at a CAGR of 15.2% during 2025-2029.

              Ai In Consumer Electronics market is segmented by Technology( Machine learning, Natural language processing, Others) Application( Personalized recommendations, Predictive maintenance, Enhanced security, Energy management, Others) Product( Computing devices, Home appliances, Entertainment devices, Communication devices, Others)

              Acer Inc., Amazon.com Inc., Apple Inc., ASUSTeK Computer Inc., Bose Corp., Canon Inc., Dell Technologies Inc., Google LLC, Haier Smart Home Co. Ltd., Hisense International Co. Ltd., HP Inc., Huawei Technologies Co. Ltd., Lenovo Group Ltd., LG Electronics Inc., Microsoft Corp., Nikon Corp., Panasonic Holdings Corp., Samsung Electronics Co. Ltd., Sony Group Corp., TCL Industries Holdings Co. Ltd., Xiaomi Inc. are a few of the key vendors in the Ai In Consumer Electronics market.

              APAC will register the highest growth rate of 37% among the other regions. Therefore, the Ai In Consumer Electronics market in APAC is expected to garner significant business opportunities for the vendors during the forecast period.

              US, China, India, UK, Japan, Canada, Germany, South Korea, France, Australia

              • Increasing consumer demand for enhanced personalization and intuitive user experiencesA primary driver propelling the global AI in consumer electronics market is the escalating consumer expectation for devices that offer deeply personalized is the driving factor this market.
              • intuitive is the driving factor this market.
              • and seamless experiences. Modern users are no longer satisfied with static is the driving factor this market.
              • one-size-fits-all functionality is the driving factor this market.
              • they demand products that learn their habits is the driving factor this market.
              • anticipate their needs is the driving factor this market.
              • and adapt to their unique contexts. Artificial intelligence is the core enabling technology that fulfills this demand by transforming passive electronics into proactive is the driving factor this market.
              • intelligent partners. AI algorithms is the driving factor this market.
              • particularly those based on machine learning is the driving factor this market.
              • analyze user interaction data to tailor everything from content recommendations on streaming platforms to the operational settings of smart home appliances. This creates a highly engaging and frictionless user experience that fosters brand loyalty and ecosystem lock-in. A clear instance of manufacturers responding to this demand is Samsung Electronics introduction of its Galaxy AI suite in January 2024. Features like Chat Assist is the driving factor this market.
              • which helps users refine their writing tone is the driving factor this market.
              • and Live Translate for real-time call translation is the driving factor this market.
              • directly address the need for more personalized and context-aware communication tools. Similarly is the driving factor this market.
              • the continuous enhancement of smart home platforms is the driving factor this market.
              • such as the features showcased by LG Electronics for its ThinQ ecosystem at the Consumer Electronics Show in January 2024 is the driving factor this market.
              • demonstrates a commitment to creating a home environment that automatically adjusts to a familys routines. By automating mundane tasks and reducing cognitive load is the driving factor this market.
              • AI-driven personalization has become a critical axis of competition and a powerful motivator for consumers to upgrade their devices. is the driving factor this market.

              The Ai In Consumer Electronics market vendors should focus on grabbing business opportunities from the Machine learning segment as it accounted for the largest market share in the base year.