AI Governance Tools Market Analysis, Size, and Forecast 2026-2030: North America (US, Canada, and Mexico), Europe (UK, Germany, and France), APAC (China, Japan, and India), South America (Brazil, Argentina, and Colombia), Middle East and Africa (UAE, Israel, and Saudi Arabia), and Rest of World (ROW)

AI Governance Tools Market Analysis, Size, and Forecast 2026-2030:
North America (US, Canada, and Mexico), Europe (UK, Germany, and France), APAC (China, Japan, and India), South America (Brazil, Argentina, and Colombia), Middle East and Africa (UAE, Israel, and Saudi Arabia), and Rest of World (ROW)

Published: Apr 2026 301 Pages SKU: IRTNTR80660

Market Overview at a Glance

$6.98 B
Market Opportunity
48.7%
CAGR 2025 - 2030
37.4%
North America Growth
$561.65 Mn
Large enterprises segment 2024

AI Governance Tools Market Size 2026-2030

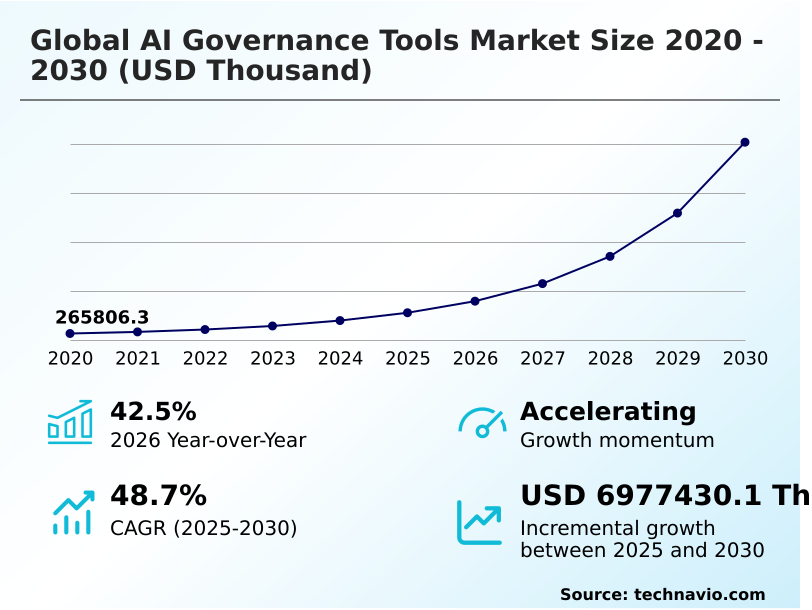
The ai governance tools market size is valued to increase by USD 6.98 billion, at a CAGR of 48.7% from 2025 to 2030. Escalating regulatory scrutiny and imperative for compliance will drive the ai governance tools market.

Major Market Trends & Insights

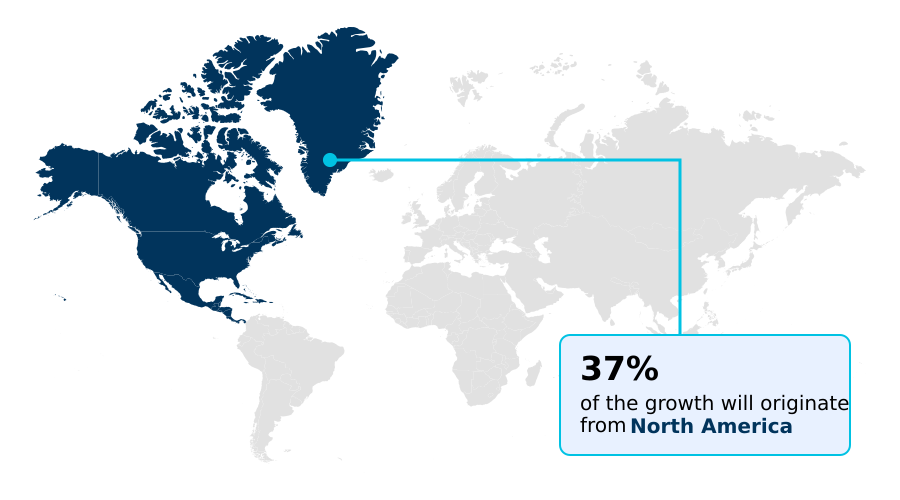
  • North America dominated the market and accounted for a 37.4% growth during the forecast period.
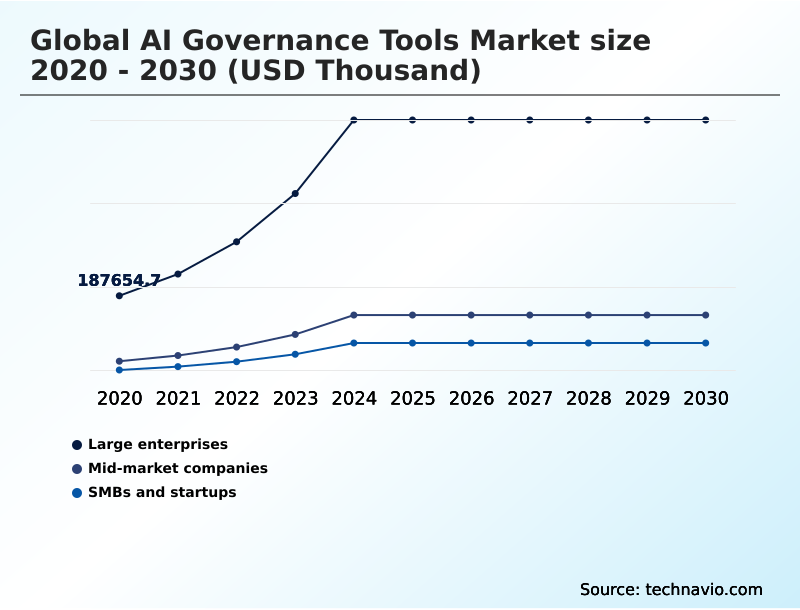
  • By End-user - Large enterprises segment was valued at USD 561.65 million in 2024
  • By Type - Risk and compliance monitoring segment accounted for the largest market revenue share in 2024

Market Size & Forecast

  • Market Opportunities:
  • Market Future Opportunities: USD 6.98 billion
  • CAGR from 2025 to 2030 : 48.7%

Market Summary

  • The AI governance tools market provides critical infrastructure for organizations to manage, monitor, and direct artificial intelligence systems responsibly. As enterprises move beyond experimental deployments to embedding AI in core business functions, the demand for structured oversight intensifies.
  • This is driven by the need to mitigate a complex spectrum of risks, from flawed business decisions caused by model drift to reputational damage from algorithmic bias. For instance, in financial services, governance platforms are essential for ensuring loan application algorithms are fair and explainable, satisfying both regulatory mandates and customer expectations for transparency.
  • Key trends include the rise of automated model validation and a strategic shift toward integrating AI risk management into broader enterprise compliance frameworks. These tools translate abstract responsible AI principles into concrete, auditable controls, enabling companies to innovate with confidence.
  • However, significant challenges related to the total cost of ownership, technical integration complexity, and a pervasive skills gap in AI ethics and compliance persist, shaping the adoption landscape.

What will be the Size of the AI Governance Tools Market during the forecast period?

Get Key Insights on Market Forecast (PDF) Request Free Sample

How is the AI Governance Tools Market Segmented?

The ai governance tools industry research report provides comprehensive data (region-wise segment analysis), with forecasts and estimates in "USD thousand" for the period 2026-2030, as well as historical data from 2020-2024 for the following segments.

  • End-user
    • Large enterprises
    • Mid-market companies
    • SMBs and startups
  • Type
    • Risk and compliance monitoring
    • Model lifecycle management
    • Bias detection and fairness auditing
    • Explainability and transparency tools
  • Deployment
    • Cloud-native SaaS
    • Hybrid or multi-cloud
    • On-premises integration
  • Geography
    • North America
      • US
      • Canada
      • Mexico
    • Europe
      • UK
      • Germany
      • France
    • APAC
      • China
      • Japan
      • India
    • South America
      • Brazil
      • Argentina
      • Colombia
    • Middle East and Africa
      • UAE
      • Israel
      • Saudi Arabia
    • Rest of World (ROW)

By End-user Insights

The large enterprises segment is estimated to witness significant growth during the forecast period.

Large enterprises represent the primary end-user segment, driven by the scale of their AI deployments and acute regulatory pressures.

For these organizations, robust AI governance is a fundamental component of risk management, requiring sophisticated platforms for end-to-end model lifecycle management and proactive compliance management.

The need for AI system reliability and operational resilience assurance mandates deep MLOps integration and tools for automated model validation.

These entities demand comprehensive solutions offering data lineage tracking, AI risk assessment, and advanced analytical capabilities like feature importance ranking and counterfactual analysis for complete decision-making transparency.

This focus on responsible innovation and brand reputation protection has led to adoption rates where governance tool implementation correlates with a 35% reduction in compliance-related incidents.

Request Free Sample

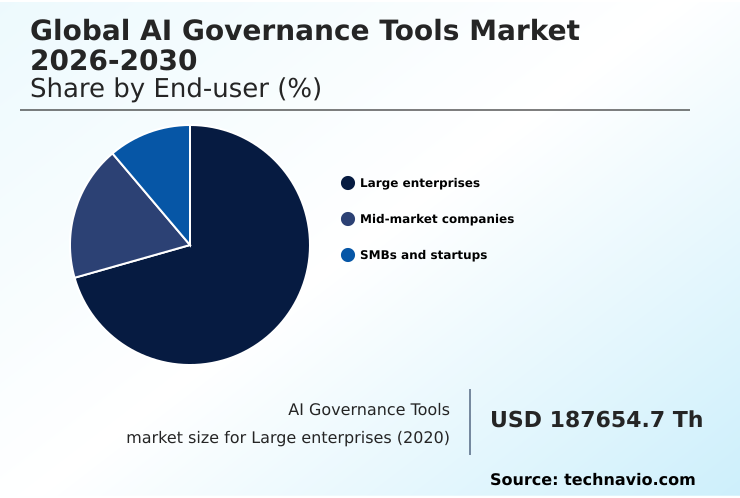
The Large enterprises segment was valued at USD 561.65 million in 2024 and showed a gradual increase during the forecast period.

Request Free Sample

Regional Analysis

North America is estimated to contribute 37.4% to the growth of the global market during the forecast period.Technavio’s analysts have elaborately explained the regional trends and drivers that shape the market during the forecast period.

See How AI Governance Tools Market Demand is Rising in North America Request Free Sample

The geographic landscape of the AI governance tools market is diverse, shaped by regional regulatory philosophies and technological maturity.

North America, accounting for over 37% of incremental growth, and Europe are driven by stringent regulations, mandating conformity assessment procedures and post-market surveillance for AI systems.

In contrast, the APAC region exhibits a more fragmented approach, with leading economies promoting voluntary frameworks that prioritize innovation enabled by federated learning and privacy-enhancing technologies.

Adoption of cloud-native SaaS platforms is highest in North America, while hybrid multi-cloud strategy is preferred by large enterprises in Europe managing data sovereignty.

Across regions, overcoming data silo remediation is a universal challenge, with successful integrations reducing audit preparation times by up to 50%, highlighting the efficiency gains from unified governance.

Market Dynamics

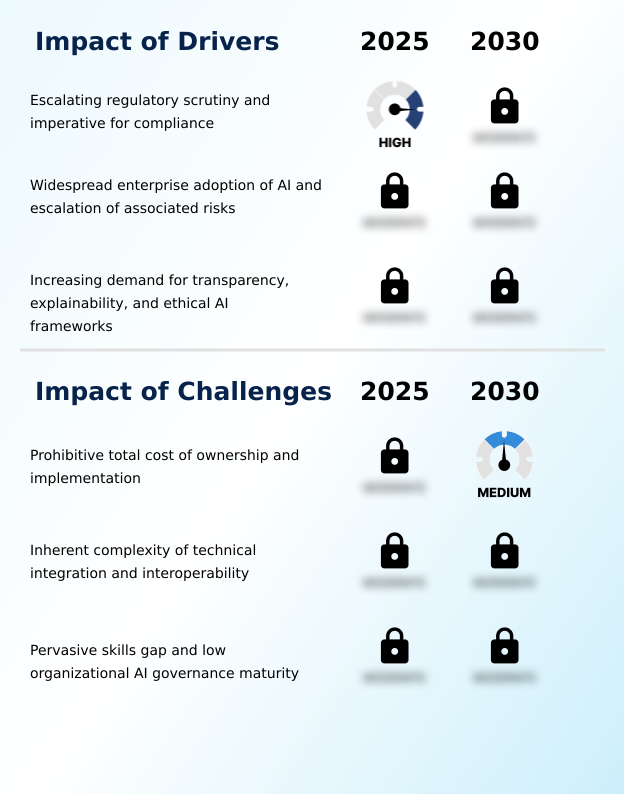
Our researchers analyzed the data with 2025 as the base year, along with the key drivers, trends, and challenges. A holistic analysis of drivers will help companies refine their marketing strategies to gain a competitive advantage.

  • As organizations operationalize artificial intelligence, the focus shifts toward ensuring sustained performance and compliance through robust governance. Managing model drift in production environments is a critical priority, necessitating tools that offer real-time performance monitoring for AI models.
  • In sectors with high-risk AI applications, such as healthcare and finance, the demand for explainable AI tools for healthcare diagnostics and automated bias detection in financial services is particularly acute. The effective AI model lifecycle management at enterprise scale requires a centralized model inventory for risk management and comprehensive data lineage tracking for AI auditability.
  • A key trend is AI governance integration with existing GRC platforms, which streamlines compliance automation for the EU AI Act and other global regulations. This integration is crucial for auditing machine learning model fairness metrics and enabling AI policy enforcement across the organization.
  • Implementing an ethical AI framework for enterprises is no longer just a technical task but a strategic imperative for building stakeholder trust with responsible AI; firms that do so see customer satisfaction scores improve at twice the rate of those that do not.
  • Addressing the high total cost of ownership for AI governance tools and overcoming the AI governance skills gap remain significant hurdles. Strategies for this include adopting flexible deployment models, like ensuring data sovereignty with on-premises AI or hybrid setups, and investing in training.
  • Proactively mitigating adversarial attacks on ML models is also a growing area of focus for maintaining system integrity.

What are the key market drivers leading to the rise in the adoption of AI Governance Tools Industry?

  • Escalating regulatory scrutiny and the growing imperative for compliance are key drivers for the adoption of AI governance tools.

  • Market growth is primarily driven by escalating regulatory pressures and the imperative for proactive compliance automation.
  • As authorities worldwide establish legal frameworks, the need for regulatory technology (regtech) for AI that provides an immutable AI audit trail generation has become critical. Non-compliance costs can be substantial, with penalties in some jurisdictions exceeding 4% of annual revenue.
  • This has spurred the adoption of tools for AI policy enforcement and centralized model inventory management. Widespread enterprise AI adoption also introduces significant operational risks, necessitating robust AI system transparency and ML model validation.
  • To build stakeholder trust and ensure corporate social responsibility, organizations are implementing tools for algorithmic bias mitigation, a move that has been shown to improve customer satisfaction by up to 20% in service-oriented industries.

What are the market trends shaping the AI Governance Tools Industry?

  • The ascendancy of explainable AI and model interpretability is a defining trend. This evolution establishes transparency as a core requirement for both corporate and regulatory governance frameworks.

  • Key market trends are centered on embedding trust and accountability directly into AI operations. The demand for explainable AI (XAI) and sophisticated model interpretability solutions is surging as organizations seek to demystify algorithmic decision-making.
  • This aligns with the strategic integration of AI governance into broader enterprise risk management (ERM) integration, with a 25% increase in firms connecting AI model data to their central GRC system connectivity. This convergence enables a holistic view of AI risk management. Advanced platforms now offer proactive concept drift monitoring and adversarial attack protection to ensure model resilience.
  • This push for transparency and control, guided by responsible AI principles and ethical AI frameworks, is essential for building stakeholder trust, a factor that top-performing companies cite as improving brand loyalty by over 30%.

What challenges does the AI Governance Tools Industry face during its growth?

  • The prohibitive total cost of ownership and the inherent complexity of implementation present a key challenge to market growth.

  • Significant challenges constrain market adoption, led by high total cost of ownership (TCO) and technical integration complexity. Integrating governance tools into existing MLOps pipeline security protocols is a major hurdle, with nearly 40% of large-scale projects experiencing delays due to interoperability challenges.
  • A pervasive AI skills gap further complicates deployment, as many organizations lack the internal talent for effective AI risk management. This low organizational AI maturity makes it difficult to implement a cohesive model governance framework.
  • Additionally, firms struggle with automated bias detection and applying consistent algorithmic fairness metrics, with an estimated 55% of models in production lacking continuous real-time performance monitoring. Addressing these issues requires a strategic focus on scalable solutions and internal upskilling.

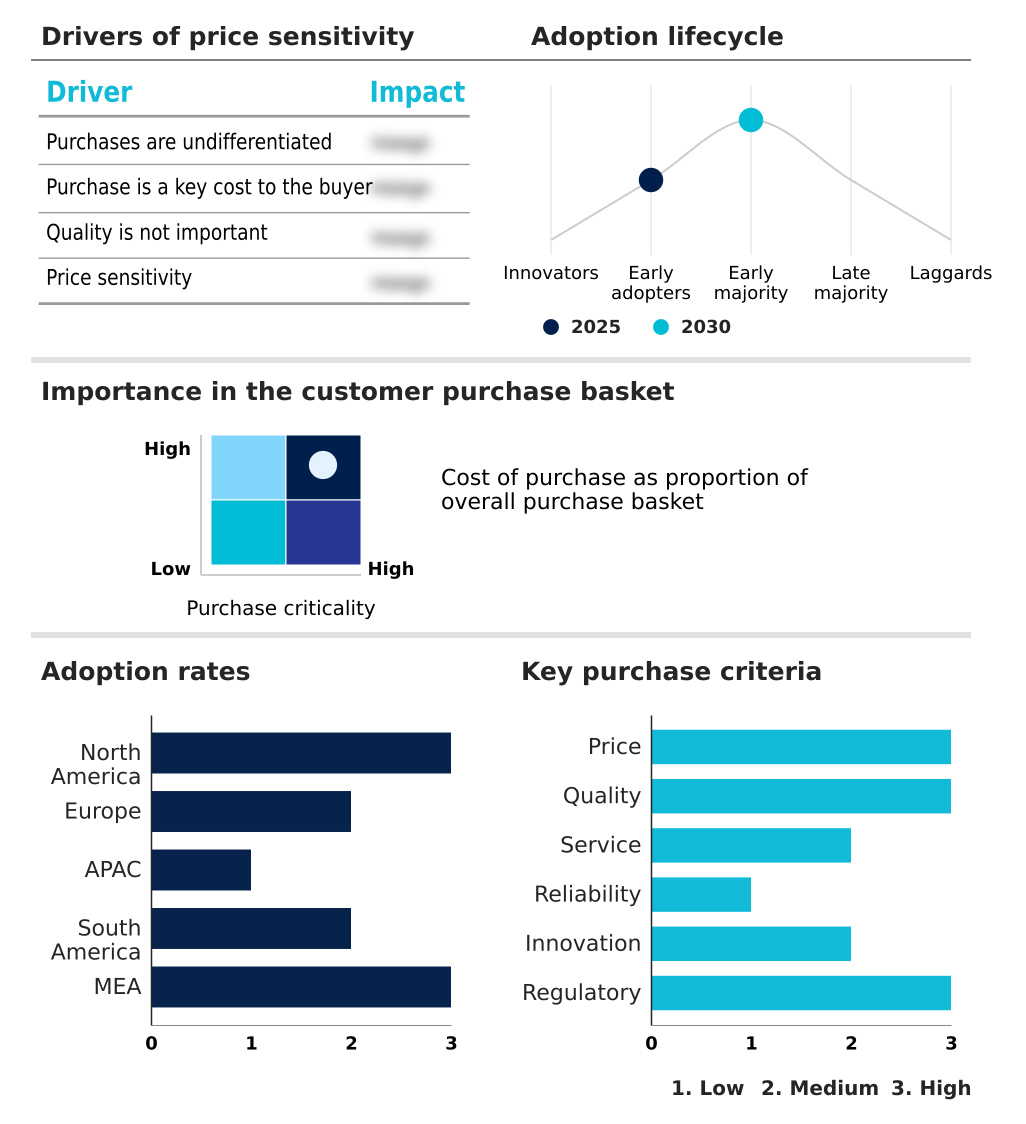
Exclusive Technavio Analysis on Customer Landscape

The ai governance tools market forecasting report includes the adoption lifecycle of the market, covering from the innovator’s stage to the laggard’s stage. It focuses on adoption rates in different regions based on penetration. Furthermore, the ai governance tools market report also includes key purchase criteria and drivers of price sensitivity to help companies evaluate and develop their market growth analysis strategies.

Customer Landscape of AI Governance Tools Industry

Competitive Landscape

Companies are implementing various strategies, such as strategic alliances, ai governance tools market forecast, partnerships, mergers and acquisitions, geographical expansion, and product/service launches, to enhance their presence in the industry.

Alteryx Inc. - The firm provides a unified data intelligence cloud platform with integrated AI governance, enabling organizations to manage risk, ensure compliance, and drive ethical AI adoption.

The industry research and growth report includes detailed analyses of the competitive landscape of the market and information about key companies, including:

  • Alteryx Inc.
  • Amazon Web Services Inc.
  • ARTHUR
  • BigID Inc.
  • Collibra
  • Credo AI
  • Dataiku Inc.
  • DataRobot Inc.
  • Fair Isaac Corp.
  • Fiddler AI
  • Google LLC
  • H2O.ai Inc.
  • IBM Corp.
  • Informatica Inc.
  • Microsoft Corp.
  • Monitaur Inc.
  • OneTrust LLC
  • SAS Institute Inc.
  • Seldon Technologies
  • Trust Arc Inc.

Qualitative and quantitative analysis of companies has been conducted to help clients understand the wider business environment as well as the strengths and weaknesses of key industry players. Data is qualitatively analyzed to categorize companies as pure play, category-focused, industry-focused, and diversified; it is quantitatively analyzed to categorize companies as dominant, leading, strong, tentative, and weak.

Recent Development and News in Ai governance tools market

  • In September 2024, DataRobot Inc. announced a strategic partnership with a leading global consulting firm to integrate its AI Platform, including advanced governance features, into the firm's digital transformation services for clients in the financial services industry.
  • In November 2024, the Asia-Pacific Economic Cooperation (APEC) forum launched its Cross-Border Responsible AI Framework, strongly recommending the use of specific AI governance tools to facilitate secure data flows and model interoperability among member economies.
  • In March 2025, Microsoft Corp. launched its new AI Governance Toolkit for users of its Azure OpenAI service, providing an integrated suite of tools for audit trails, risk management, and policy compliance to foster responsible AI deployment.
  • In April 2025, OneTrust LLC acquired a specialized AI explainability startup for approximately $150 million, integrating its advanced model interpretation and counterfactual analysis capabilities into the OneTrust privacy and data governance platform.

Dive into Technavio’s robust research methodology, blending expert interviews, extensive data synthesis, and validated models for unparalleled AI Governance Tools Market insights. See full methodology.

Market Scope
Page number 301
Base year 2025
Historic period 2020-2024
Forecast period 2026-2030
Growth momentum & CAGR Accelerate at a CAGR of 48.7%
Market growth 2026-2030 USD 6977430.1 thousand
Market structure Fragmented
YoY growth 2025-2026(%) 42.5%
Key countries US, Canada, Mexico, UK, Germany, France, Italy, The Netherlands, Spain, China, Japan, India, South Korea, Australia, Indonesia, Brazil, Argentina, Colombia, UAE, Israel, Saudi Arabia, South Africa and Turkey
Competitive landscape Leading Companies, Market Positioning of Companies, Competitive Strategies, and Industry Risks

Request Free Sample

Research Analyst Overview

  • The AI governance tools market is maturing into an essential infrastructural layer for any enterprise deploying artificial intelligence at scale. Boardroom-level decisions are increasingly influenced by the need for a defensible model governance framework that addresses legal liability and brand reputation, making explainable AI (XAI) and model interpretability solutions non-negotiable.
  • Implementing a centralized model inventory is fundamental for MLOps integration, enabling data provenance tracking and real-time performance monitoring to manage high-risk AI applications. Tools providing algorithmic bias mitigation and algorithmic fairness metrics are critical for meeting regulatory demands, while capabilities for synthetic data detection and data poisoning detection are key for security.
  • The use of privacy-enhancing technologies, federated learning, and human-in-the-loop oversight is becoming standard. For compliance, AI audit trail generation, conformity assessment procedures, and post-market surveillance are vital. Firms that leverage automated model validation report up to a 40% reduction in compliance reporting errors, underscoring the tangible business impact of these platforms.

What are the Key Data Covered in this AI Governance Tools Market Research and Growth Report?

  • What is the expected growth of the AI Governance Tools Market between 2026 and 2030?

    • USD 6.98 billion, at a CAGR of 48.7%

  • What segmentation does the market report cover?

    • The report is segmented by End-user (Large enterprises, Mid-market companies, and SMBs and startups), Type (Risk and compliance monitoring, Model lifecycle management, Bias detection and fairness auditing, and Explainability and transparency tools), Deployment (Cloud-native SaaS, Hybrid or multi-cloud, and On-premises integration) and Geography (North America, Europe, APAC, South America, Middle East and Africa)

  • Which regions are analyzed in the report?

    • North America, Europe, APAC, South America and Middle East and Africa

  • What are the key growth drivers and market challenges?

    • Escalating regulatory scrutiny and imperative for compliance, Prohibitive total cost of ownership and implementation

  • Who are the major players in the AI Governance Tools Market?

    • Alteryx Inc., Amazon Web Services Inc., ARTHUR, BigID Inc., Collibra, Credo AI, Dataiku Inc., DataRobot Inc., Fair Isaac Corp., Fiddler AI, Google LLC, H2O.ai Inc., IBM Corp., Informatica Inc., Microsoft Corp., Monitaur Inc., OneTrust LLC, SAS Institute Inc., Seldon Technologies and Trust Arc Inc.

Market Research Insights

  • The market is shaped by the dynamic interplay between responsible innovation and reputational risk mitigation. Organizations are implementing AI accountability mechanisms to build stakeholder trust, a strategy that improves customer retention by over 15% in regulated industries. The adoption of cloud-native SaaS solutions has accelerated, with firms reporting a 30% faster model deployment velocity compared to on-premises integration.
  • Effective AI governance also hinges on organizational AI maturity and addressing the AI skills gap. Proactive compliance management through these tools not only navigates the complex regulatory landscape but also delivers a tangible ROI, as automated platforms reduce audit-related operational overhead by more than 40%.

We can help! Our analysts can customize this ai governance tools market research report to meet your requirements.

Get in touch

1. Executive Summary

1.1 Market overview

Executive Summary - Chart on Market Overview
Executive Summary - Data Table on Market Overview
Executive Summary - Chart on Global Market Characteristics
Executive Summary - Chart on Market by Geography
Executive Summary - Chart on Market Segmentation by End-user
Executive Summary - Chart on Market Segmentation by Type
Executive Summary - Chart on Market Segmentation by Deployment
Executive Summary - Chart on Incremental Growth
Executive Summary - Data Table on Incremental Growth
Executive Summary - Chart on Company Market Positioning

2. Technavio Analysis

2.1 Analysis of price sensitivity, lifecycle, customer purchase basket, adoption rates, and purchase criteria

2.2 Criticality of inputs and Factors of differentiation

Chart on Overview on criticality of inputs and factors of differentiation

2.3 Factors of disruption

Chart on Overview on factors of disruption

2.4 Impact of drivers and challenges

Chart on Impact of drivers and challenges in 2025 and 2030

3. Market Landscape

3.1 Market ecosystem

Chart on Parent Market
Data Table on - Parent Market

3.2 Market characteristics

Chart on Market characteristics analysis

3.3 Value chain analysis

Chart on Value chain analysis

4. Market Sizing

4.1 Market definition

Data Table on Offerings of companies included in the market definition

4.2 Market segment analysis

Market segments

4.3 Market size 2025

4.4 Market outlook: Forecast for 2025-2030

Chart on Global - Market size and forecast 2025-2030 ($ thousand)
Data Table on Global - Market size and forecast 2025-2030 ($ thousand)
Chart on Global Market: Year-over-year growth 2025-2030 (%)
Data Table on Global Market: Year-over-year growth 2025-2030 (%)

5. Historic Market Size

5.1 Global AI Governance Tools Market 2020 - 2024

Historic Market Size - Data Table on Global AI Governance Tools Market 2020 - 2024 ($ thousand)

5.2 End-user segment analysis 2020 - 2024

Historic Market Size - End-user Segment 2020 - 2024 ($ thousand)

5.3 Type segment analysis 2020 - 2024

Historic Market Size - Type Segment 2020 - 2024 ($ thousand)

5.4 Deployment segment analysis 2020 - 2024

Historic Market Size - Deployment Segment 2020 - 2024 ($ thousand)

5.5 Geography segment analysis 2020 - 2024

Historic Market Size - Geography Segment 2020 - 2024 ($ thousand)

5.6 Country segment analysis 2020 - 2024

Historic Market Size - Country Segment 2020 - 2024 ($ thousand)

6. Qualitative Analysis

6.1 Impact of geopolitical conflicts on global AI governance tools market

7. Five Forces Analysis

7.1 Five forces summary

Five forces analysis - Comparison between 2025 and 2030

7.2 Bargaining power of buyers

Bargaining power of buyers - Impact of key factors 2025 and 2030

7.3 Bargaining power of suppliers

Bargaining power of suppliers - Impact of key factors in 2025 and 2030

7.4 Threat of new entrants

Threat of new entrants - Impact of key factors in 2025 and 2030

7.5 Threat of substitutes

Threat of substitutes - Impact of key factors in 2025 and 2030

7.6 Threat of rivalry

Threat of rivalry - Impact of key factors in 2025 and 2030

7.7 Market condition

Chart on Market condition - Five forces 2025 and 2030

8. Market Segmentation by End-user

8.1 Market segments

Chart on End-user - Market share 2025-2030 (%)
Data Table on End-user - Market share 2025-2030 (%)

8.2 Comparison by End-user

Chart on Comparison by End-user
Data Table on Comparison by End-user

8.3 Large enterprises - Market size and forecast 2025-2030

Chart on Large enterprises - Market size and forecast 2025-2030 ($ thousand)
Data Table on Large enterprises - Market size and forecast 2025-2030 ($ thousand)
Chart on Large enterprises - Year-over-year growth 2025-2030 (%)
Data Table on Large enterprises - Year-over-year growth 2025-2030 (%)

8.4 Mid-market companies - Market size and forecast 2025-2030

Chart on Mid-market companies - Market size and forecast 2025-2030 ($ thousand)
Data Table on Mid-market companies - Market size and forecast 2025-2030 ($ thousand)
Chart on Mid-market companies - Year-over-year growth 2025-2030 (%)
Data Table on Mid-market companies - Year-over-year growth 2025-2030 (%)

8.5 SMBs and startups - Market size and forecast 2025-2030

Chart on SMBs and startups - Market size and forecast 2025-2030 ($ thousand)
Data Table on SMBs and startups - Market size and forecast 2025-2030 ($ thousand)
Chart on SMBs and startups - Year-over-year growth 2025-2030 (%)
Data Table on SMBs and startups - Year-over-year growth 2025-2030 (%)

8.6 Market opportunity by End-user

Market opportunity by End-user ($ thousand)
Data Table on Market opportunity by End-user ($ thousand)

9. Market Segmentation by Type

9.1 Market segments

Chart on Type - Market share 2025-2030 (%)
Data Table on Type - Market share 2025-2030 (%)

9.2 Comparison by Type

Chart on Comparison by Type
Data Table on Comparison by Type

9.3 Risk and compliance monitoring - Market size and forecast 2025-2030

Chart on Risk and compliance monitoring - Market size and forecast 2025-2030 ($ thousand)
Data Table on Risk and compliance monitoring - Market size and forecast 2025-2030 ($ thousand)
Chart on Risk and compliance monitoring - Year-over-year growth 2025-2030 (%)
Data Table on Risk and compliance monitoring - Year-over-year growth 2025-2030 (%)

9.4 Model lifecycle management - Market size and forecast 2025-2030

Chart on Model lifecycle management - Market size and forecast 2025-2030 ($ thousand)
Data Table on Model lifecycle management - Market size and forecast 2025-2030 ($ thousand)
Chart on Model lifecycle management - Year-over-year growth 2025-2030 (%)
Data Table on Model lifecycle management - Year-over-year growth 2025-2030 (%)

9.5 Bias detection and fairness auditing - Market size and forecast 2025-2030

Chart on Bias detection and fairness auditing - Market size and forecast 2025-2030 ($ thousand)
Data Table on Bias detection and fairness auditing - Market size and forecast 2025-2030 ($ thousand)
Chart on Bias detection and fairness auditing - Year-over-year growth 2025-2030 (%)
Data Table on Bias detection and fairness auditing - Year-over-year growth 2025-2030 (%)

9.6 Explainability and transparency tools - Market size and forecast 2025-2030

Chart on Explainability and transparency tools - Market size and forecast 2025-2030 ($ thousand)
Data Table on Explainability and transparency tools - Market size and forecast 2025-2030 ($ thousand)
Chart on Explainability and transparency tools - Year-over-year growth 2025-2030 (%)
Data Table on Explainability and transparency tools - Year-over-year growth 2025-2030 (%)

9.7 Market opportunity by Type

Market opportunity by Type ($ thousand)
Data Table on Market opportunity by Type ($ thousand)

10. Market Segmentation by Deployment

10.1 Market segments

Chart on Deployment - Market share 2025-2030 (%)
Data Table on Deployment - Market share 2025-2030 (%)

10.2 Comparison by Deployment

Chart on Comparison by Deployment
Data Table on Comparison by Deployment

10.3 Cloud-native SaaS - Market size and forecast 2025-2030

Chart on Cloud-native SaaS - Market size and forecast 2025-2030 ($ thousand)
Data Table on Cloud-native SaaS - Market size and forecast 2025-2030 ($ thousand)
Chart on Cloud-native SaaS - Year-over-year growth 2025-2030 (%)
Data Table on Cloud-native SaaS - Year-over-year growth 2025-2030 (%)

10.4 Hybrid or multi-cloud - Market size and forecast 2025-2030

Chart on Hybrid or multi-cloud - Market size and forecast 2025-2030 ($ thousand)
Data Table on Hybrid or multi-cloud - Market size and forecast 2025-2030 ($ thousand)
Chart on Hybrid or multi-cloud - Year-over-year growth 2025-2030 (%)
Data Table on Hybrid or multi-cloud - Year-over-year growth 2025-2030 (%)

10.5 On-premises integration - Market size and forecast 2025-2030

Chart on On-premises integration - Market size and forecast 2025-2030 ($ thousand)
Data Table on On-premises integration - Market size and forecast 2025-2030 ($ thousand)
Chart on On-premises integration - Year-over-year growth 2025-2030 (%)
Data Table on On-premises integration - Year-over-year growth 2025-2030 (%)

10.6 Market opportunity by Deployment

Market opportunity by Deployment ($ thousand)
Data Table on Market opportunity by Deployment ($ thousand)

11. Customer Landscape

11.1 Customer landscape overview

Analysis of price sensitivity, lifecycle, customer purchase basket, adoption rates, and purchase criteria

12. Geographic Landscape

12.1 Geographic segmentation

Chart on Market share by geography 2025-2030 (%)
Data Table on Market share by geography 2025-2030 (%)

12.2 Geographic comparison

Chart on Geographic comparison
Data Table on Geographic comparison

12.3 North America - Market size and forecast 2025-2030

Chart on North America - Market size and forecast 2025-2030 ($ thousand)
Data Table on North America - Market size and forecast 2025-2030 ($ thousand)
Chart on North America - Year-over-year growth 2025-2030 (%)
Data Table on North America - Year-over-year growth 2025-2030 (%)
Chart on Regional Comparison - North America
Data Table on Regional Comparison - North America

12.3.1 US - Market size and forecast 2025-2030

Chart on US - Market size and forecast 2025-2030 ($ thousand)
Data Table on US - Market size and forecast 2025-2030 ($ thousand)
Chart on US - Year-over-year growth 2025-2030 (%)
Data Table on US - Year-over-year growth 2025-2030 (%)

12.3.2 Canada - Market size and forecast 2025-2030

Chart on Canada - Market size and forecast 2025-2030 ($ thousand)
Data Table on Canada - Market size and forecast 2025-2030 ($ thousand)
Chart on Canada - Year-over-year growth 2025-2030 (%)
Data Table on Canada - Year-over-year growth 2025-2030 (%)

12.3.3 Mexico - Market size and forecast 2025-2030

Chart on Mexico - Market size and forecast 2025-2030 ($ thousand)
Data Table on Mexico - Market size and forecast 2025-2030 ($ thousand)
Chart on Mexico - Year-over-year growth 2025-2030 (%)
Data Table on Mexico - Year-over-year growth 2025-2030 (%)

12.4 Europe - Market size and forecast 2025-2030

Chart on Europe - Market size and forecast 2025-2030 ($ thousand)
Data Table on Europe - Market size and forecast 2025-2030 ($ thousand)
Chart on Europe - Year-over-year growth 2025-2030 (%)
Data Table on Europe - Year-over-year growth 2025-2030 (%)
Chart on Regional Comparison - Europe
Data Table on Regional Comparison - Europe

12.4.1 UK - Market size and forecast 2025-2030

Chart on UK - Market size and forecast 2025-2030 ($ thousand)
Data Table on UK - Market size and forecast 2025-2030 ($ thousand)
Chart on UK - Year-over-year growth 2025-2030 (%)
Data Table on UK - Year-over-year growth 2025-2030 (%)

12.4.2 Germany - Market size and forecast 2025-2030

Chart on Germany - Market size and forecast 2025-2030 ($ thousand)
Data Table on Germany - Market size and forecast 2025-2030 ($ thousand)
Chart on Germany - Year-over-year growth 2025-2030 (%)
Data Table on Germany - Year-over-year growth 2025-2030 (%)

12.4.3 France - Market size and forecast 2025-2030

Chart on France - Market size and forecast 2025-2030 ($ thousand)
Data Table on France - Market size and forecast 2025-2030 ($ thousand)
Chart on France - Year-over-year growth 2025-2030 (%)
Data Table on France - Year-over-year growth 2025-2030 (%)

12.4.4 Italy - Market size and forecast 2025-2030

Chart on Italy - Market size and forecast 2025-2030 ($ thousand)
Data Table on Italy - Market size and forecast 2025-2030 ($ thousand)
Chart on Italy - Year-over-year growth 2025-2030 (%)
Data Table on Italy - Year-over-year growth 2025-2030 (%)

12.4.5 The Netherlands - Market size and forecast 2025-2030

Chart on The Netherlands - Market size and forecast 2025-2030 ($ thousand)
Data Table on The Netherlands - Market size and forecast 2025-2030 ($ thousand)
Chart on The Netherlands - Year-over-year growth 2025-2030 (%)
Data Table on The Netherlands - Year-over-year growth 2025-2030 (%)

12.4.6 Spain - Market size and forecast 2025-2030

Chart on Spain - Market size and forecast 2025-2030 ($ thousand)
Data Table on Spain - Market size and forecast 2025-2030 ($ thousand)
Chart on Spain - Year-over-year growth 2025-2030 (%)
Data Table on Spain - Year-over-year growth 2025-2030 (%)

12.5 APAC - Market size and forecast 2025-2030

Chart on APAC - Market size and forecast 2025-2030 ($ thousand)
Data Table on APAC - Market size and forecast 2025-2030 ($ thousand)
Chart on APAC - Year-over-year growth 2025-2030 (%)
Data Table on APAC - Year-over-year growth 2025-2030 (%)
Chart on Regional Comparison - APAC
Data Table on Regional Comparison - APAC

12.5.1 China - Market size and forecast 2025-2030

Chart on China - Market size and forecast 2025-2030 ($ thousand)
Data Table on China - Market size and forecast 2025-2030 ($ thousand)
Chart on China - Year-over-year growth 2025-2030 (%)
Data Table on China - Year-over-year growth 2025-2030 (%)

12.5.2 Japan - Market size and forecast 2025-2030

Chart on Japan - Market size and forecast 2025-2030 ($ thousand)
Data Table on Japan - Market size and forecast 2025-2030 ($ thousand)
Chart on Japan - Year-over-year growth 2025-2030 (%)
Data Table on Japan - Year-over-year growth 2025-2030 (%)

12.5.3 India - Market size and forecast 2025-2030

Chart on India - Market size and forecast 2025-2030 ($ thousand)
Data Table on India - Market size and forecast 2025-2030 ($ thousand)
Chart on India - Year-over-year growth 2025-2030 (%)
Data Table on India - Year-over-year growth 2025-2030 (%)

12.5.4 South Korea - Market size and forecast 2025-2030

Chart on South Korea - Market size and forecast 2025-2030 ($ thousand)
Data Table on South Korea - Market size and forecast 2025-2030 ($ thousand)
Chart on South Korea - Year-over-year growth 2025-2030 (%)
Data Table on South Korea - Year-over-year growth 2025-2030 (%)

12.5.5 Australia - Market size and forecast 2025-2030

Chart on Australia - Market size and forecast 2025-2030 ($ thousand)
Data Table on Australia - Market size and forecast 2025-2030 ($ thousand)
Chart on Australia - Year-over-year growth 2025-2030 (%)
Data Table on Australia - Year-over-year growth 2025-2030 (%)

12.5.6 Indonesia - Market size and forecast 2025-2030

Chart on Indonesia - Market size and forecast 2025-2030 ($ thousand)
Data Table on Indonesia - Market size and forecast 2025-2030 ($ thousand)
Chart on Indonesia - Year-over-year growth 2025-2030 (%)
Data Table on Indonesia - Year-over-year growth 2025-2030 (%)

12.6 South America - Market size and forecast 2025-2030

Chart on South America - Market size and forecast 2025-2030 ($ thousand)
Data Table on South America - Market size and forecast 2025-2030 ($ thousand)
Chart on South America - Year-over-year growth 2025-2030 (%)
Data Table on South America - Year-over-year growth 2025-2030 (%)
Chart on Regional Comparison - South America
Data Table on Regional Comparison - South America

12.6.1 Brazil - Market size and forecast 2025-2030

Chart on Brazil - Market size and forecast 2025-2030 ($ thousand)
Data Table on Brazil - Market size and forecast 2025-2030 ($ thousand)
Chart on Brazil - Year-over-year growth 2025-2030 (%)
Data Table on Brazil - Year-over-year growth 2025-2030 (%)

12.6.2 Argentina - Market size and forecast 2025-2030

Chart on Argentina - Market size and forecast 2025-2030 ($ thousand)
Data Table on Argentina - Market size and forecast 2025-2030 ($ thousand)
Chart on Argentina - Year-over-year growth 2025-2030 (%)
Data Table on Argentina - Year-over-year growth 2025-2030 (%)

12.6.3 Colombia - Market size and forecast 2025-2030

Chart on Colombia - Market size and forecast 2025-2030 ($ thousand)
Data Table on Colombia - Market size and forecast 2025-2030 ($ thousand)
Chart on Colombia - Year-over-year growth 2025-2030 (%)
Data Table on Colombia - Year-over-year growth 2025-2030 (%)

12.7 Middle East and Africa - Market size and forecast 2025-2030

Chart on Middle East and Africa - Market size and forecast 2025-2030 ($ thousand)
Data Table on Middle East and Africa - Market size and forecast 2025-2030 ($ thousand)
Chart on Middle East and Africa - Year-over-year growth 2025-2030 (%)
Data Table on Middle East and Africa - Year-over-year growth 2025-2030 (%)
Chart on Regional Comparison - Middle East and Africa
Data Table on Regional Comparison - Middle East and Africa

12.7.1 UAE - Market size and forecast 2025-2030

Chart on UAE - Market size and forecast 2025-2030 ($ thousand)
Data Table on UAE - Market size and forecast 2025-2030 ($ thousand)
Chart on UAE - Year-over-year growth 2025-2030 (%)
Data Table on UAE - Year-over-year growth 2025-2030 (%)

12.7.2 Israel - Market size and forecast 2025-2030

Chart on Israel - Market size and forecast 2025-2030 ($ thousand)
Data Table on Israel - Market size and forecast 2025-2030 ($ thousand)
Chart on Israel - Year-over-year growth 2025-2030 (%)
Data Table on Israel - Year-over-year growth 2025-2030 (%)

12.7.3 Saudi Arabia - Market size and forecast 2025-2030

Chart on Saudi Arabia - Market size and forecast 2025-2030 ($ thousand)
Data Table on Saudi Arabia - Market size and forecast 2025-2030 ($ thousand)
Chart on Saudi Arabia - Year-over-year growth 2025-2030 (%)
Data Table on Saudi Arabia - Year-over-year growth 2025-2030 (%)

12.7.4 South Africa - Market size and forecast 2025-2030

Chart on South Africa - Market size and forecast 2025-2030 ($ thousand)
Data Table on South Africa - Market size and forecast 2025-2030 ($ thousand)
Chart on South Africa - Year-over-year growth 2025-2030 (%)
Data Table on South Africa - Year-over-year growth 2025-2030 (%)

12.7.5 Turkey - Market size and forecast 2025-2030

Chart on Turkey - Market size and forecast 2025-2030 ($ thousand)
Data Table on Turkey - Market size and forecast 2025-2030 ($ thousand)
Chart on Turkey - Year-over-year growth 2025-2030 (%)
Data Table on Turkey - Year-over-year growth 2025-2030 (%)

12.8 Market opportunity by geography

Market opportunity by geography ($ thousand)
Data Tables on Market opportunity by geography ($ thousand)

13. Drivers, Challenges, and Opportunity

13.1 Market drivers

Escalating regulatory scrutiny and imperative for compliance
Widespread enterprise adoption of AI and escalation of associated risks
Increasing demand for transparency, explainability, and ethical AI frameworks

13.2 Market challenges

Prohibitive total cost of ownership and implementation
Inherent complexity of technical integration and interoperability
Pervasive skills gap and low organizational AI governance maturity

13.3 Impact of drivers and challenges

Impact of drivers and challenges in 2025 and 2030

13.4 Market opportunities

Ascendancy of explainable AI and model interpretability as core governance requirement
Strategic convergence of AI governance with broader enterprise risk management frameworks
Proliferation of automated solutions for continuous model monitoring and lifecycle validation

14. Competitive Landscape

14.1 Overview

14.2

Overview on criticality of inputs and factors of differentiation

14.3 Landscape disruption

Overview on factors of disruption

14.4 Industry risks

Impact of key risks on business

15. Competitive Analysis

15.1 Companies profiled

Companies covered

15.2 Company ranking index

15.3 Market positioning of companies

Matrix on companies position and classification

15.4 Alteryx Inc.

Alteryx Inc. - Overview
Alteryx Inc. - Product / Service
Alteryx Inc. - Key offerings
SWOT

15.5 Amazon Web Services Inc.

Amazon Web Services Inc. - Overview
Amazon Web Services Inc. - Product / Service
Amazon Web Services Inc. - Key offerings
SWOT

15.6 BigID Inc.

BigID Inc. - Overview
BigID Inc. - Product / Service
BigID Inc. - Key offerings
SWOT

15.7 Collibra

Collibra - Overview
Collibra - Product / Service
Collibra - Key offerings
SWOT

15.8 Dataiku Inc.

Dataiku Inc. - Overview
Dataiku Inc. - Product / Service
Dataiku Inc. - Key offerings
SWOT

15.9 DataRobot Inc.

DataRobot Inc. - Overview
DataRobot Inc. - Product / Service
DataRobot Inc. - Key offerings
SWOT

15.10 Fair Isaac Corp.

Fair Isaac Corp. - Overview
Fair Isaac Corp. - Business segments
Fair Isaac Corp. - Key news
Fair Isaac Corp. - Key offerings
Fair Isaac Corp. - Segment focus
SWOT

15.11 Google LLC

Google LLC - Overview
Google LLC - Product / Service
Google LLC - Key offerings
SWOT

15.12 H2O.ai Inc.

H2O.ai Inc. - Overview
H2O.ai Inc. - Product / Service
H2O.ai Inc. - Key offerings
SWOT

15.13 IBM Corp.

IBM Corp. - Overview
IBM Corp. - Business segments
IBM Corp. - Key news
IBM Corp. - Key offerings
IBM Corp. - Segment focus
SWOT

15.14 Informatica Inc.

Informatica Inc. - Overview
Informatica Inc. - Business segments
Informatica Inc. - Key offerings
Informatica Inc. - Segment focus
SWOT

15.15 Microsoft Corp.

Microsoft Corp. - Overview
Microsoft Corp. - Business segments
Microsoft Corp. - Key news
Microsoft Corp. - Key offerings
Microsoft Corp. - Segment focus
SWOT

15.16 SAS Institute Inc.

SAS Institute Inc. - Overview
SAS Institute Inc. - Product / Service
SAS Institute Inc. - Key offerings
SWOT

15.17 Seldon Technologies

Seldon Technologies - Overview
Seldon Technologies - Product / Service
Seldon Technologies - Key offerings
SWOT

15.18 Trust Arc Inc.

Trust Arc Inc. - Overview
Trust Arc Inc. - Product / Service
Trust Arc Inc. - Key offerings
SWOT

16. Appendix

16.1 Scope of the report

Market definition
Objectives
Notes and caveats

16.2 Inclusions and exclusions checklist

Inclusions checklist
Exclusions checklist

16.3 Currency conversion rates for US$

16.4 Research methodology

16.5 Data procurement

Information sources

16.6 Data validation

16.7 Validation techniques employed for market sizing

16.8 Data synthesis

16.9 360 degree market analysis

16.10 List of abbreviations

Research Methodology

Technavio presents a detailed picture of the market by way of study, synthesis, and summation of data from multiple sources. The analysts have presented the various facets of the market with a particular focus on identifying the key industry influencers. The data thus presented is comprehensive, reliable, and the result of extensive research, both primary and secondary.

INFORMATION SOURCES

Primary sources

  • Manufacturers and suppliers
  • Channel partners
  • Industry experts
  • Strategic decision makers

Secondary sources

  • Industry journals and periodicals
  • Government data
  • Financial reports of key industry players
  • Historical data
  • Press releases

DATA ANALYSIS

Data Synthesis

  • Collation of data
  • Estimation of key figures
  • Analysis of derived insights

Data Validation

  • Triangulation with data models
  • Reference against proprietary databases
  • Corroboration with industry experts

REPORT WRITING

Qualitative

  • Market drivers
  • Market challenges
  • Market trends
  • Five forces analysis

Quantitative

  • Market size and forecast
  • Market segmentation
  • Geographical insights
  • Competitive landscape

Interested in this report?

Get your sample now to see our research methodology and insights!

Download Now

Frequently Asked Questions

AI Governance Tools market growth will increase by USD 6977430.1 thousand thousand during 2026-2030.

The AI Governance Tools market is expected to grow at a CAGR of 48.7% during 2026-2030.

AI Governance Tools market is segmented by End-user (Large enterprises, Mid-market companies, SMBs and startups) Type (Risk and compliance monitoring, Model lifecycle management, Bias detection and fairness auditing, Explainability and transparency tools) Deployment (Cloud-native SaaS, Hybrid or multi-cloud, On-premises integration)

Alteryx Inc., Amazon Web Services Inc., ARTHUR, BigID Inc., Collibra, Credo AI, Dataiku Inc., DataRobot Inc., Fair Isaac Corp., Fiddler AI, Google LLC, H2O.ai Inc., IBM Corp., Informatica Inc., Microsoft Corp., Monitaur Inc., OneTrust LLC, SAS Institute Inc., Seldon Technologies, Trust Arc Inc. are a few of the key vendors in the AI Governance Tools market.

North America will register the highest growth rate of 37.4% among the other regions. Therefore, the AI Governance Tools market in North America is expected to garner significant business opportunities for the vendors during the forecast period.

US, Canada, Mexico, UK, Germany, France, Italy, The Netherlands, Spain, China, Japan, India, South Korea, Australia, Indonesia, Brazil, Argentina, Colombia, UAE, Israel, Saudi Arabia, South Africa, Turkey

  • Escalating regulatory scrutiny and imperative for compliance is the driving factor this market.

The AI Governance Tools market vendors should focus on grabbing business opportunities from the End-user segment as it accounted for the largest market share in the base year.
RIA - Research AI Assistant
Ask RIA