Agricultural Microbials Market Analysis, Size, and Forecast 2025-2029: North America (US and Canada), Europe (France, Germany, Italy, UK), APAC (China, India, Japan, South Korea), South America , and Middle East and Africa

Agricultural Microbials Market Analysis, Size, and Forecast 2025-2029:
North America (US and Canada), Europe (France, Germany, Italy, UK), APAC (China, India, Japan, South Korea), South America , and Middle East and Africa

Published: Mar 2025 211 Pages SKU: IRTNTR74561

Market Overview at a Glance

$7.99 B
Market Opportunity
20.3%
CAGR
15.0
YoY growth 2024-2025(%)

Agricultural Microbials Market Size 2025-2029

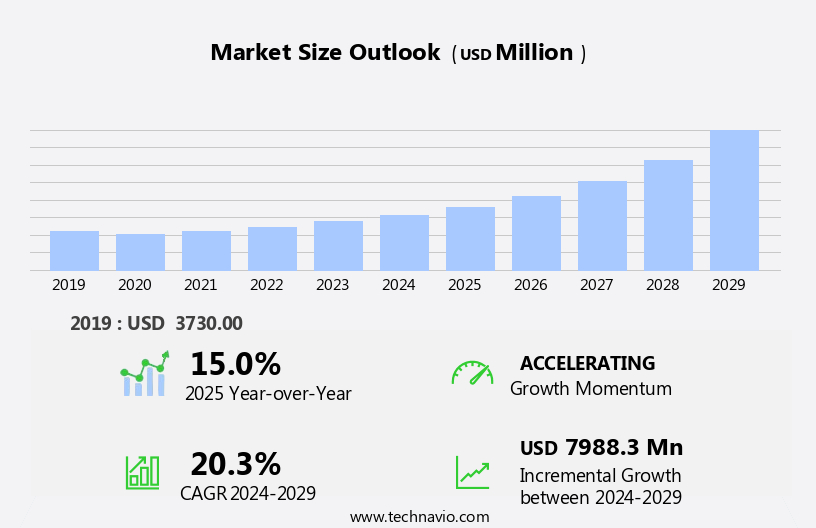
The agricultural microbials market size is forecast to increase by USD 7.99 billion at a CAGR of 20.3% between 2024 and 2029.

  • The market is experiencing significant growth driven by the increasing adoption of organic farming practices and global initiatives to enhance agricultural output. Organic farming, which relies on the use of microbials for crop protection and soil health, is gaining popularity due to consumer demand for healthier and more sustainable food production methods. Furthermore, governments and international organizations are investing in research and development to improve agricultural productivity, making microbials an essential tool in modern farming. However, the market is also influenced by ecological considerations, such as greenhouse gas emissions and soil structures. Medium and small-sized enterprises are key players in the market, with many specializing in the production of soluble liquids for agricultural applications. Microbial products offer effective solutions for pest prevention and disease management under various climate conditions. 
  • This cost barrier may limit the market's growth potential in certain regions, particularly in developing countries. Additionally, the regulatory environment for microbial products can be complex and varied, requiring extensive testing and approval processes. Companies seeking to capitalize on market opportunities must navigate these challenges effectively by investing in research and development, building strategic partnerships, and focusing on cost-effective production methods. Overall, the market presents significant opportunities for growth, particularly in the organic farming sector, and companies that can address affordability and regulatory challenges will be well-positioned for success.

What will be the Size of the Agricultural Microbials Market during the forecast period?

Agricultural Microbials Market Size

 Request Free Sample

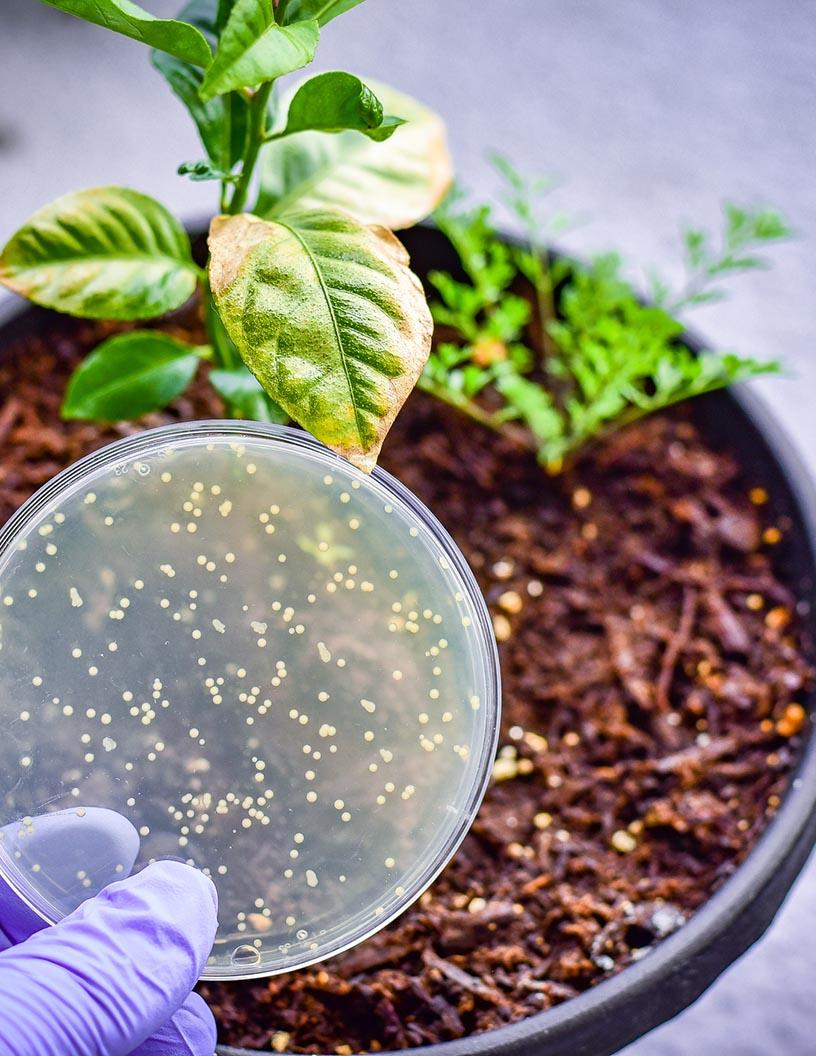
  • The market encompasses a range of products derived from microorganisms, including biologicals such as biopesticides, biofertilizers, and biostimulants. These innovative solutions enhance plant health, promote organic farming practices, and contribute to sustainable agriculture. Microbial derivatives, including bacterial strains and fungal applications, are used for seed treatment, foliar spray, and soil amendments. By improving pest resistance, nutrient uptake, and soil health, agricultural microbials offer an alternative to synthetic chemicals in crop protection. 
  • The market's growth is driven by the increasing demand for organic food products, environmental safety, and consumer preference for sustainable agriculture practices. Biostimulants improve plant growth and yield by enhancing nutrient uptake and promoting stress tolerance. Organic agriculture and conventional farming both benefit from the use of these microbial-based products, which can boost crop yield while minimizing environmental impact. The market's size and direction reflect the growing importance of plant health and food safety in global agriculture.

How is the Agricultural Microbials Industry segmented?

The agricultural microbials industry research report provides comprehensive data (region-wise segment analysis), with forecasts and estimates in "USD million" for the period 2025-2029, as well as historical data from 2019-2023 for the following segments.

  • Crop Type
    • Cereals and grains
    • Oilseeds and pulses
    • Fruits and vegetables
    • Others
  • Type
    • Soil amendment
    • Crop protection
  • Product Specification
    • Bacteria
    • Fungi
    • Virus
    • Protozoa
    • Others
  • Geography
    • North America
      • US
      • Canada
    • Europe
      • France
      • Germany
      • Italy
      • UK
    • APAC
      • China
      • India
      • Japan
      • South Korea
    • South America
    • Middle East and Africa

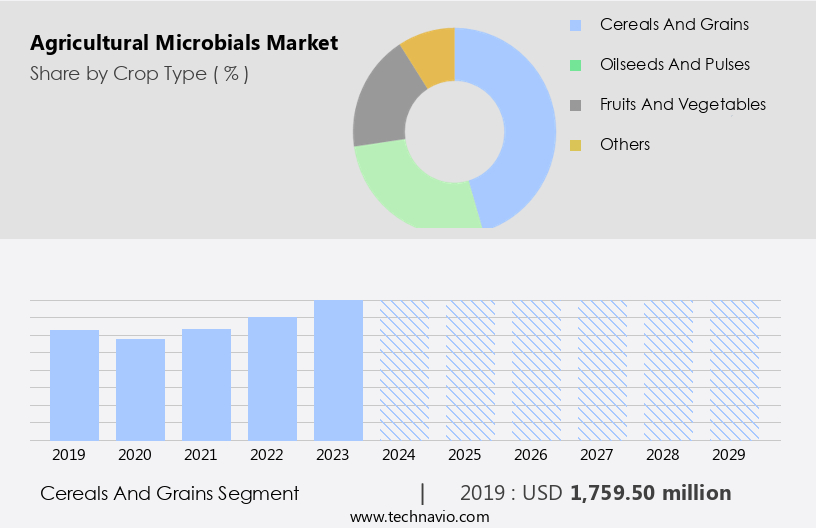
By Crop Type Insights

The cereals and grains segment is estimated to witness significant growth during the forecast period. The market is experiencing significant growth due to the increasing global population and the demand for sustainable farming practices. By 2050, the Food and Agriculture Organization (FAO) predicts that there will be nine billion people on the planet, necessitating an increase in food production. This demand is driving the need for crop intensification, which involves increasing yields per acre while pursuing sustainable practices. Additionally, public concerns over food safety and environmental impact have led to the adoption of microbial products as biological substitutes for synthetic fertilizers and pesticides. These products can help mitigate biotic stress, such as plant pests and diseases, as well as abiotic stress, such as salts and nutrient imbalances, in the soil.

Microbial products are also effective in pest prevention and resistance, reducing the need for chemical pesticides and contributing to agricultural sustainability. The market for agricultural microbials includes soluble liquids, commercial formulation types, and seed treatments for various crops, including cereals and grains, oilseeds and pulses, fruits and vegetables, horticulture crops, and sugarcane. Market demand is further driven by the need to address climate conditions and the yield gap, as well as the desire to reduce greenhouse gas emissions. Medium and small-sized enterprises are key players in the market, offering a range of microbial products and solutions.

Agricultural Microbials Market Size

Get a glance at the market report of share of various segments Request Free Sample

The Cereals and grains segment was valued at USD 1.76 billion in 2019 and showed a gradual increase during the forecast period.

Regional Analysis

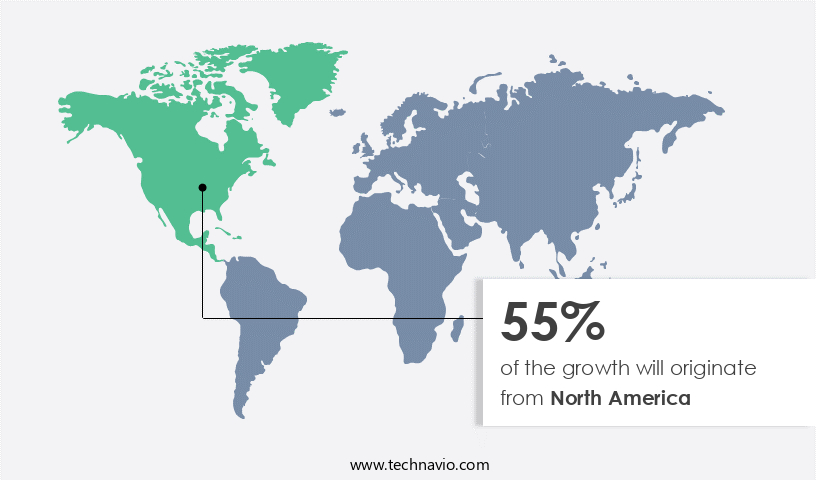
North America is estimated to contribute 55% to the growth of the global market during the forecast period. Technavio's analysts have elaborately explained the regional trends and drivers that shape the market during the forecast period.

Agricultural Microbials Market Share by Geography

For more insights on the market size of various regions, Request Free Sample

The market in North America is experiencing significant growth due to the increasing adoption of organic farming practices and the conversion of conventional farms to organic. High-value crops are being grown more frequently, leading farmers to seek out microbial solutions for environmental benefits. Government investment in the region is essential to meet the population's needs, driving demand for microbiological solutions. Consumer concerns regarding food safety and quality are also increasing, further boosting market growth. Agricultural microbials offer effective pest prevention and resistance, as well as soil enhancement through the use of lactic acid bacteria, soil bacteria, and viable microorganisms.

Furthermore, the population in North America is becoming increasingly health-conscious and food safety-focused, leading to a greater emphasis on the use of microbial products for storage requirements and nutrient enhancement. Filamentous fungi, yeast, and other microbial strains are being extensively researched to create additional biological solutions for various agricultural applications. The governments in the region are also investing more in agricultural research to meet the growing food demand and ensure food safety, further fueling the market growth. Overall, the market in North America is poised for continued expansion, driven by the need for sustainable and effective crop protection products.

Market Dynamics

Our researchers analyzed the data with 2024 as the base year, along with the key drivers, trends, and challenges. A holistic analysis of drivers will help companies refine their marketing strategies to gain a competitive advantage.

What are the key market drivers leading to the rise in the adoption of the Agricultural Microbials Industry?

  • The growing adoption of organic farming is the key driver of the market. The global agricultural landscape is undergoing a shift towards more sustainable farming practices due to the increasing awareness of the health hazards associated with the use of chemicals in food production. The pressure on land and natural resources, coupled with the accelerated rate of crop production, results in the rapid loss of plant nutrients. Consequently, farmers have been relying heavily on inorganic fertilizers to replenish the soil. However, excessive use of these fertilizers can decelerate biological activities in the soil, leading to impaired soil quality. In response, the organic farming industry is experiencing growth as farmers seek more sustainable options.
  • Organic farming avoids the use of synthetic fertilizers, pesticides, and genetically modified organisms (GMOs), making it a healthier and more environmentally friendly alternative. This trend is expected to continue as consumers become more conscious of their food choices and demand for healthier and more sustainable food options increases. The organic farming market is poised for significant growth as farmers and consumers alike recognize the long-term benefits of this sustainable farming approach.

What are the market trends shaping the Agricultural Microbials Industry?

  • Global initiatives to improve agricultural output are the upcoming market trend. The global agricultural sector faces the challenge of feeding a growing population while ensuring food safety and security. The Food and Agriculture Organization (FAO) plays a crucial role in this regard, focusing on the sustainable management of natural resources to maximize agriculture's contribution to national economies. FAO's Regional Initiative supports countries in managing their resources sustainably, addressing climate change, and mitigating risks to agriculture, forestry, and fisheries. This necessitates the implementation of stringent quality standards for agricultural products as the number of farming operations increases.
  • FAO secures funding for these projects from various sources, including the Green Climate Fund (GCF) and the Global Environment Facility (GEF). The organization's efforts underscore the importance of maintaining food safety and security in the context of a growing global population.

What challenges does the Agricultural Microbials Industry face during its growth?

  • Issues with product affordability is a key challenge affecting the industry's growth. Agricultural microbials, essential for enhancing crop productivity, face challenges in reaching developing countries, particularly in South America and Africa. Despite the benefits, high costs and limited accessibility hinder their implementation in these regions, where demand for crop production is significant. Products such as biopesticides, biofertilizers, and biostimulants all fall under the umbrella of agricultural microbials, offering effective solutions for crop protection and environmental sustainability.
  • Price sensitivity among farmers in low- and middle-income economies is a major barrier, leading them to prefer traditional microbials over advanced organic alternatives. Lack of adequate information about advanced agricultural microbials further compounds the issue. These obstacles have far-reaching consequences, potentially impacting agricultural productivity on a large scale.

Exclusive Customer Landscape

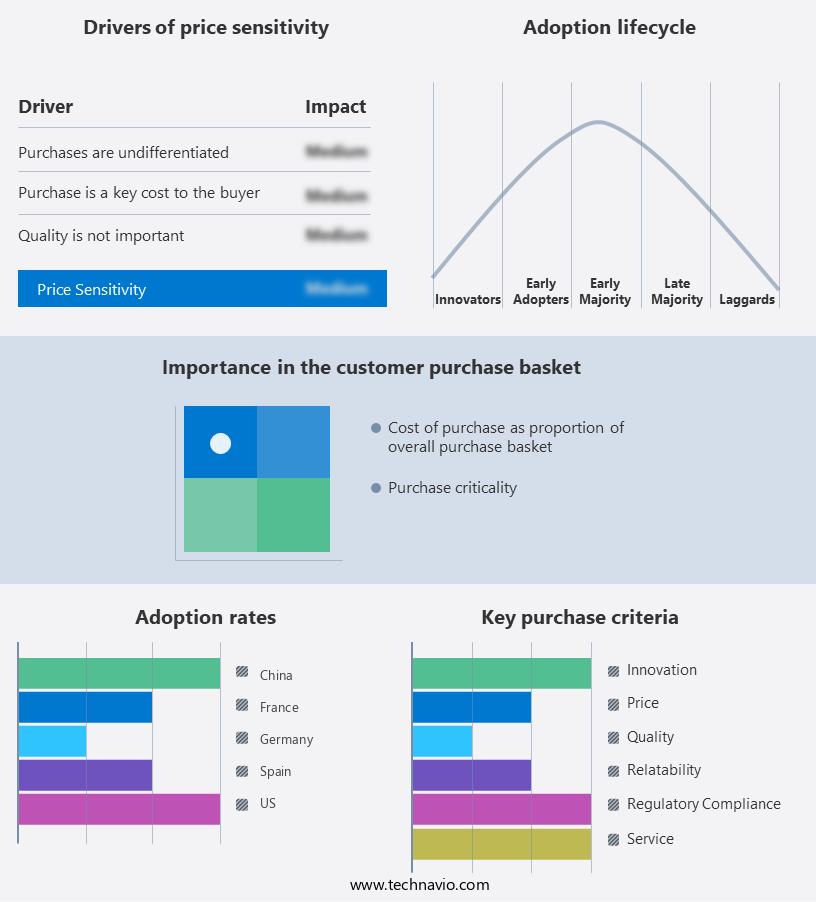
The agricultural microbials market forecasting report includes the adoption lifecycle of the market, covering from the innovator's stage to the laggard's stage. It focuses on adoption rates in different regions based on penetration. Furthermore, the agricultural microbials market report also includes key purchase criteria and drivers of price sensitivity to help companies evaluate and develop their market growth analysis strategies.

Agricultural Microbials Market Share by Geography

 Customer Landscape

Key Companies & Market Insights

Companies are implementing various strategies, such as strategic alliances, agricultural microbials market forecast, partnerships, mergers and acquisitions, geographical expansion, and product/service launches, to enhance their presence in the industry.

AgBiome Inc. - The company offers agricultural microbials that stimulate natural plant processes, allowing the full expression of the plant's genetic potential, especially under stress conditions.

The industry research and growth report includes detailed analyses of the competitive landscape of the market and information about key companies, including:

  • AgBiome Inc.
  • AGRICULTURE SOLUTIONS INC.
  • Arysta LifeScience Corp.
  • BASF SE
  • Bayer AG
  • Biomar Microbial Technologies
  • Certis USA LLC
  • Corteva Inc.
  • Emnz
  • Isagro Spa
  • Koppert Biological Systems
  • Lallemand Inc.
  • LOCUS AG SOLUTIONS
  • Novonesis Group
  • Sumitomo Chemical Co. Ltd.
  • Syngenta Crop Protection AG
  • UPL Ltd.
  • Verdesian Life Sciences LLC

Qualitative and quantitative analysis of companies has been conducted to help clients understand the wider business environment as well as the strengths and weaknesses of key industry players. Data is qualitatively analyzed to categorize companies as pure play, category-focused, industry-focused, and diversified; it is quantitatively analyzed to categorize companies as dominant, leading, strong, tentative, and weak.

Research Analyst Overview

Agricultural microbials have emerged as a significant segment in the global crop management market, offering sustainable solutions for farmers seeking to enhance crop productivity and resilience against biotic and abiotic stressors. These microbial products, derived from beneficial bacteria and other microorganisms, play a crucial role in organic agriculture by promoting soil health, enhancing nutrient availability, and providing natural pest control. The market dynamics are driven by several factors. The increasing demand for organic food products and the growing awareness of environmental impact have fueled the adoption of organic farming practices. Organic agriculture relies on natural methods for pest prevention and soil enhancement, making microbial products an essential component of this approach.

The use of agricultural microbials offers several advantages over conventional crop protection methods. Microbial insecticides and fungicides provide effective pest control while minimizing the environmental impact compared to synthetic chemicals. Moreover, the use of microbial products can help reduce the reliance on chemical fertilizers and promote soil structures that improve water retention and nutrient cycling. The market caters to various crops, including legume crops, cereals and grains, oilseeds and pulses, horticulture crops, and sugarcane. The market comprises a diverse range of microbial products, including soluble liquids, commercial formulations, and seed treatments. These products can be formulated as dry or liquid suspensions, foliar sprays, or soil treatments.

The market for agricultural microbials is not limited to large-scale commercial operations. Medium and small-sized enterprises also play a significant role in the market, catering to the growing demand for sustainable agricultural practices. Some of the common microorganisms used in agricultural microbials include lactic acid bacteria, soil bacteria, and viable microorganisms. The market is subject to various market forces. Biotic stressors, such as insect populations and fungal diseases, can impact crop yields and market demand. Abiotic stressors, such as climate conditions and storage requirements, can also influence market dynamics. The use of agricultural microbials can contribute to agricultural sustainability by reducing greenhouse gas emissions and promoting soil health.

For instance, the use of biological nitrogen fixation through rhizobium legume symbioses can help reduce the reliance on synthetic fertilizers. The market for agricultural microbials is expected to grow as farmers seek sustainable and effective solutions for crop management. The increasing awareness of food safety and environmental safety concerns is also driving the demand for microbial products in organic agriculture. However, the market faces challenges, such as regulatory requirements, production costs, and competition from chemical crop protection products. The market offers sustainable solutions for crop management, promoting agricultural sustainability and reducing the environmental impact of conventional farming practices.

The market dynamics are driven by various factors, including market demand, biotic and abiotic stressors, and the adoption of sustainable agriculture practices. The market caters to various crops and farm sizes and offers a diverse range of microbial products to meet the growing demand for organic food and sustainable agriculture.

Market Scope

Report Coverage

Details

Page number

211

Base year

2024

Historic period

2019-2023

Forecast period

2025-2029

Growth momentum & CAGR

Accelerate at a CAGR of 20.3%

Market growth 2025-2029

USD 7.98 billion

Market structure

Fragmented

YoY growth 2024-2025(%)

15.0

Key countries

US, Germany, China, UK, Canada, France, Italy, Japan, India, and South Korea

Competitive landscape

Leading Companies, Market Positioning of Companies, Competitive Strategies, and Industry Risks

Request Free Sample

What are the Key Data Covered in this Agricultural Microbials Market Research and Growth Report?

  • CAGR of the Agricultural Microbials industry during the forecast period
  • Detailed information on factors that will drive the growth and forecasting between 2025 and 2029
  • Precise estimation of the size of the market and its contribution of the industry in focus to the parent market
  • Accurate predictions about upcoming growth and trends and changes in consumer behaviour
  • Growth of the market across North America, Europe, APAC, South America, and Middle East and Africa
  • Thorough analysis of the market's competitive landscape and detailed information about companies
  • Comprehensive analysis of factors that will challenge the agricultural microbials market growth and forecasting 

We can help! Our analysts can customize this agricultural microbials market research report to meet your requirements.

Get in touch

1 Executive Summary

  • 1.1 Market overview
    • Executive Summary - Chart on Market Overview
    • Executive Summary - Data Table on Market Overview
    • Executive Summary - Chart on Global Market Characteristics
    • Executive Summary - Chart on Market by Geography
    • Executive Summary - Chart on Market Segmentation by Crop Type
    • Executive Summary - Chart on Market Segmentation by Type
    • Executive Summary - Chart on Market Segmentation by Product Specification
    • Executive Summary - Chart on Incremental Growth
    • Executive Summary - Data Table on Incremental Growth
    • Executive Summary - Chart on Company Market Positioning

2 Technavio Analysis

  • 2.1 Analysis of price sensitivity, lifecycle, customer purchase basket, adoption rates, and purchase criteria
    • Analysis of price sensitivity, lifecycle, customer purchase basket, adoption rates, and purchase criteria
  • 2.2 Criticality of inputs and Factors of differentiation
    • Overview on criticality of inputs and factors of differentiation
  • 2.3 Factors of disruption
    • Overview on factors of disruption
  • 2.4 Impact of drivers and challenges
    • Impact of drivers and challenges in 2024 and 2029

3 Market Landscape

  • 3.1 Market ecosystem
    • Parent Market
    • Data Table on - Parent Market
  • 3.2 Market characteristics
    • Market characteristics analysis
  • 3.3 Value chain analysis
    • Value chain analysis

4 Market Sizing

  • 4.1 Market definition
    • Offerings of companies included in the market definition
  • 4.2 Market segment analysis
    • Market segments
  • 4.3 Market size 2024
    • 4.4 Market outlook: Forecast for 2024-2029
      • Chart on Global - Market size and forecast 2024-2029 ($ million)
      • Data Table on Global - Market size and forecast 2024-2029 ($ million)
      • Chart on Global Market: Year-over-year growth 2024-2029 (%)
      • Data Table on Global Market: Year-over-year growth 2024-2029 (%)

    5 Historic Market Size

    • 5.1 Global Agricultural Microbials Market 2019 - 2023
      • Historic Market Size - Data Table on Global Agricultural Microbials Market 2019 - 2023 ($ million)
    • 5.2 Crop Type segment analysis 2019 - 2023
      • Historic Market Size - Crop Type Segment 2019 - 2023 ($ million)
    • 5.3 Type segment analysis 2019 - 2023
      • Historic Market Size - Type Segment 2019 - 2023 ($ million)
    • 5.4 Product Specification segment analysis 2019 - 2023
      • Historic Market Size - Product Specification Segment 2019 - 2023 ($ million)
    • 5.5 Geography segment analysis 2019 - 2023
      • Historic Market Size - Geography Segment 2019 - 2023 ($ million)
    • 5.6 Country segment analysis 2019 - 2023
      • Historic Market Size - Country Segment 2019 - 2023 ($ million)

    6 Qualitative Analysis

    • 6.1 Impact of AI on the global agricultural microbials market

      7 Five Forces Analysis

      • 7.1 Five forces summary
        • Five forces analysis - Comparison between 2024 and 2029
      • 7.2 Bargaining power of buyers
        • Bargaining power of buyers - Impact of key factors 2024 and 2029
      • 7.3 Bargaining power of suppliers
        • Bargaining power of suppliers - Impact of key factors in 2024 and 2029
      • 7.4 Threat of new entrants
        • Threat of new entrants - Impact of key factors in 2024 and 2029
      • 7.5 Threat of substitutes
        • Threat of substitutes - Impact of key factors in 2024 and 2029
      • 7.6 Threat of rivalry
        • Threat of rivalry - Impact of key factors in 2024 and 2029
      • 7.7 Market condition
        • Chart on Market condition - Five forces 2024 and 2029

      8 Market Segmentation by Crop Type

      • 8.1 Market segments
        • Chart on Crop Type - Market share 2024-2029 (%)
        • Data Table on Crop Type - Market share 2024-2029 (%)
      • 8.2 Comparison by Crop Type
        • Chart on Comparison by Crop Type
        • Data Table on Comparison by Crop Type
      • 8.3 Cereals and grains - Market size and forecast 2024-2029
        • Chart on Cereals and grains - Market size and forecast 2024-2029 ($ million)
        • Data Table on Cereals and grains - Market size and forecast 2024-2029 ($ million)
        • Chart on Cereals and grains - Year-over-year growth 2024-2029 (%)
        • Data Table on Cereals and grains - Year-over-year growth 2024-2029 (%)
      • 8.4 Oilseeds and pulses - Market size and forecast 2024-2029
        • Chart on Oilseeds and pulses - Market size and forecast 2024-2029 ($ million)
        • Data Table on Oilseeds and pulses - Market size and forecast 2024-2029 ($ million)
        • Chart on Oilseeds and pulses - Year-over-year growth 2024-2029 (%)
        • Data Table on Oilseeds and pulses - Year-over-year growth 2024-2029 (%)
      • 8.5 Fruits and vegetables - Market size and forecast 2024-2029
        • Chart on Fruits and vegetables - Market size and forecast 2024-2029 ($ million)
        • Data Table on Fruits and vegetables - Market size and forecast 2024-2029 ($ million)
        • Chart on Fruits and vegetables - Year-over-year growth 2024-2029 (%)
        • Data Table on Fruits and vegetables - Year-over-year growth 2024-2029 (%)
      • 8.6 Others - Market size and forecast 2024-2029
        • Chart on Others - Market size and forecast 2024-2029 ($ million)
        • Data Table on Others - Market size and forecast 2024-2029 ($ million)
        • Chart on Others - Year-over-year growth 2024-2029 (%)
        • Data Table on Others - Year-over-year growth 2024-2029 (%)
      • 8.7 Market opportunity by Crop Type
        • Market opportunity by Crop Type ($ million)
        • Data Table on Market opportunity by Crop Type ($ million)

      9 Market Segmentation by Type

      • 9.1 Market segments
        • Chart on Type - Market share 2024-2029 (%)
        • Data Table on Type - Market share 2024-2029 (%)
      • 9.2 Comparison by Type
        • Chart on Comparison by Type
        • Data Table on Comparison by Type
      • 9.3 Soil amendment - Market size and forecast 2024-2029
        • Chart on Soil amendment - Market size and forecast 2024-2029 ($ million)
        • Data Table on Soil amendment - Market size and forecast 2024-2029 ($ million)
        • Chart on Soil amendment - Year-over-year growth 2024-2029 (%)
        • Data Table on Soil amendment - Year-over-year growth 2024-2029 (%)
      • 9.4 Crop protection - Market size and forecast 2024-2029
        • Chart on Crop protection - Market size and forecast 2024-2029 ($ million)
        • Data Table on Crop protection - Market size and forecast 2024-2029 ($ million)
        • Chart on Crop protection - Year-over-year growth 2024-2029 (%)
        • Data Table on Crop protection - Year-over-year growth 2024-2029 (%)
      • 9.5 Market opportunity by Type
        • Market opportunity by Type ($ million)
        • Data Table on Market opportunity by Type ($ million)

      10 Market Segmentation by Product Specification

      • 10.1 Market segments
        • Chart on Product Specification - Market share 2024-2029 (%)
        • Data Table on Product Specification - Market share 2024-2029 (%)
      • 10.2 Comparison by Product Specification
        • Chart on Comparison by Product Specification
        • Data Table on Comparison by Product Specification
      • 10.3 Bacteria - Market size and forecast 2024-2029
        • Chart on Bacteria - Market size and forecast 2024-2029 ($ million)
        • Data Table on Bacteria - Market size and forecast 2024-2029 ($ million)
        • Chart on Bacteria - Year-over-year growth 2024-2029 (%)
        • Data Table on Bacteria - Year-over-year growth 2024-2029 (%)
      • 10.4 Fungi - Market size and forecast 2024-2029
        • Chart on Fungi - Market size and forecast 2024-2029 ($ million)
        • Data Table on Fungi - Market size and forecast 2024-2029 ($ million)
        • Chart on Fungi - Year-over-year growth 2024-2029 (%)
        • Data Table on Fungi - Year-over-year growth 2024-2029 (%)
      • 10.5 Virus - Market size and forecast 2024-2029
        • Chart on Virus - Market size and forecast 2024-2029 ($ million)
        • Data Table on Virus - Market size and forecast 2024-2029 ($ million)
        • Chart on Virus - Year-over-year growth 2024-2029 (%)
        • Data Table on Virus - Year-over-year growth 2024-2029 (%)
      • 10.6 Protozoa - Market size and forecast 2024-2029
        • Chart on Protozoa - Market size and forecast 2024-2029 ($ million)
        • Data Table on Protozoa - Market size and forecast 2024-2029 ($ million)
        • Chart on Protozoa - Year-over-year growth 2024-2029 (%)
        • Data Table on Protozoa - Year-over-year growth 2024-2029 (%)
      • 10.7 Others - Market size and forecast 2024-2029
        • Chart on Others - Market size and forecast 2024-2029 ($ million)
        • Data Table on Others - Market size and forecast 2024-2029 ($ million)
        • Chart on Others - Year-over-year growth 2024-2029 (%)
        • Data Table on Others - Year-over-year growth 2024-2029 (%)
      • 10.8 Market opportunity by Product Specification
        • Market opportunity by Product Specification ($ million)
        • Data Table on Market opportunity by Product Specification ($ million)

      11 Customer Landscape

      • 11.1 Customer landscape overview
        • Analysis of price sensitivity, lifecycle, customer purchase basket, adoption rates, and purchase criteria

      12 Geographic Landscape

      • 12.1 Geographic segmentation
        • Chart on Market share by geography 2024-2029 (%)
        • Data Table on Market share by geography 2024-2029 (%)
      • 12.2 Geographic comparison
        • Chart on Geographic comparison
        • Data Table on Geographic comparison
      • 12.3 North America - Market size and forecast 2024-2029
        • Chart on North America - Market size and forecast 2024-2029 ($ million)
        • Data Table on North America - Market size and forecast 2024-2029 ($ million)
        • Chart on North America - Year-over-year growth 2024-2029 (%)
        • Data Table on North America - Year-over-year growth 2024-2029 (%)
      • 12.4 Europe - Market size and forecast 2024-2029
        • Chart on Europe - Market size and forecast 2024-2029 ($ million)
        • Data Table on Europe - Market size and forecast 2024-2029 ($ million)
        • Chart on Europe - Year-over-year growth 2024-2029 (%)
        • Data Table on Europe - Year-over-year growth 2024-2029 (%)
      • 12.5 APAC - Market size and forecast 2024-2029
        • Chart on APAC - Market size and forecast 2024-2029 ($ million)
        • Data Table on APAC - Market size and forecast 2024-2029 ($ million)
        • Chart on APAC - Year-over-year growth 2024-2029 (%)
        • Data Table on APAC - Year-over-year growth 2024-2029 (%)
      • 12.6 South America - Market size and forecast 2024-2029
        • Chart on South America - Market size and forecast 2024-2029 ($ million)
        • Data Table on South America - Market size and forecast 2024-2029 ($ million)
        • Chart on South America - Year-over-year growth 2024-2029 (%)
        • Data Table on South America - Year-over-year growth 2024-2029 (%)
      • 12.7 Middle East and Africa - Market size and forecast 2024-2029
        • Chart on Middle East and Africa - Market size and forecast 2024-2029 ($ million)
        • Data Table on Middle East and Africa - Market size and forecast 2024-2029 ($ million)
        • Chart on Middle East and Africa - Year-over-year growth 2024-2029 (%)
        • Data Table on Middle East and Africa - Year-over-year growth 2024-2029 (%)
      • 12.8 US - Market size and forecast 2024-2029
        • Chart on US - Market size and forecast 2024-2029 ($ million)
        • Data Table on US - Market size and forecast 2024-2029 ($ million)
        • Chart on US - Year-over-year growth 2024-2029 (%)
        • Data Table on US - Year-over-year growth 2024-2029 (%)
      • 12.9 Germany - Market size and forecast 2024-2029
        • Chart on Germany - Market size and forecast 2024-2029 ($ million)
        • Data Table on Germany - Market size and forecast 2024-2029 ($ million)
        • Chart on Germany - Year-over-year growth 2024-2029 (%)
        • Data Table on Germany - Year-over-year growth 2024-2029 (%)
      • 12.10 China - Market size and forecast 2024-2029
        • Chart on China - Market size and forecast 2024-2029 ($ million)
        • Data Table on China - Market size and forecast 2024-2029 ($ million)
        • Chart on China - Year-over-year growth 2024-2029 (%)
        • Data Table on China - Year-over-year growth 2024-2029 (%)
      • 12.11 UK - Market size and forecast 2024-2029
        • Chart on UK - Market size and forecast 2024-2029 ($ million)
        • Data Table on UK - Market size and forecast 2024-2029 ($ million)
        • Chart on UK - Year-over-year growth 2024-2029 (%)
        • Data Table on UK - Year-over-year growth 2024-2029 (%)
      • 12.12 Canada - Market size and forecast 2024-2029
        • Chart on Canada - Market size and forecast 2024-2029 ($ million)
        • Data Table on Canada - Market size and forecast 2024-2029 ($ million)
        • Chart on Canada - Year-over-year growth 2024-2029 (%)
        • Data Table on Canada - Year-over-year growth 2024-2029 (%)
      • 12.13 France - Market size and forecast 2024-2029
        • Chart on France - Market size and forecast 2024-2029 ($ million)
        • Data Table on France - Market size and forecast 2024-2029 ($ million)
        • Chart on France - Year-over-year growth 2024-2029 (%)
        • Data Table on France - Year-over-year growth 2024-2029 (%)
      • 12.14 Italy - Market size and forecast 2024-2029
        • Chart on Italy - Market size and forecast 2024-2029 ($ million)
        • Data Table on Italy - Market size and forecast 2024-2029 ($ million)
        • Chart on Italy - Year-over-year growth 2024-2029 (%)
        • Data Table on Italy - Year-over-year growth 2024-2029 (%)
      • 12.15 Japan - Market size and forecast 2024-2029
        • Chart on Japan - Market size and forecast 2024-2029 ($ million)
        • Data Table on Japan - Market size and forecast 2024-2029 ($ million)
        • Chart on Japan - Year-over-year growth 2024-2029 (%)
        • Data Table on Japan - Year-over-year growth 2024-2029 (%)
      • 12.16 India - Market size and forecast 2024-2029
        • Chart on India - Market size and forecast 2024-2029 ($ million)
        • Data Table on India - Market size and forecast 2024-2029 ($ million)
        • Chart on India - Year-over-year growth 2024-2029 (%)
        • Data Table on India - Year-over-year growth 2024-2029 (%)
      • 12.17 South Korea - Market size and forecast 2024-2029
        • Chart on South Korea - Market size and forecast 2024-2029 ($ million)
        • Data Table on South Korea - Market size and forecast 2024-2029 ($ million)
        • Chart on South Korea - Year-over-year growth 2024-2029 (%)
        • Data Table on South Korea - Year-over-year growth 2024-2029 (%)
      • 12.18 Market opportunity by geography
        • Market opportunity by geography ($ million)
        • Data Tables on Market opportunity by geography ($ million)

      13 Drivers, Challenges, and Opportunity/Restraints

      • 13.1 Market drivers
        • 13.2 Market challenges
          • 13.3 Impact of drivers and challenges
            • Impact of drivers and challenges in 2024 and 2029
          • 13.4 Market opportunities/restraints

            14 Competitive Landscape

            • 14.1 Overview
              • 14.2 Competitive Landscape
                • Overview on criticality of inputs and factors of differentiation
              • 14.3 Landscape disruption
                • Overview on factors of disruption
              • 14.4 Industry risks
                • Impact of key risks on business

              15 Competitive Analysis

              • 15.1 Companies profiled
                • Companies covered
              • 15.2 Company ranking index
                • Company ranking index
              • 15.3 Market positioning of companies
                • Matrix on companies position and classification
              • 15.4 AgBiome Inc.
                • AgBiome Inc. - Overview
                • AgBiome Inc. - Product / Service
                • AgBiome Inc. - Key offerings
                • SWOT
              • 15.5 Arysta LifeScience Corp.
                • Arysta LifeScience Corp. - Overview
                • Arysta LifeScience Corp. - Product / Service
                • Arysta LifeScience Corp. - Key offerings
                • SWOT
              • 15.6 BASF SE
                • BASF SE - Overview
                • BASF SE - Business segments
                • BASF SE - Key news
                • BASF SE - Key offerings
                • BASF SE - Segment focus
                • SWOT
              • 15.7 Bayer AG
                • Bayer AG - Overview
                • Bayer AG - Business segments
                • Bayer AG - Key news
                • Bayer AG - Key offerings
                • Bayer AG - Segment focus
                • SWOT
              • 15.8 Certis USA LLC
                • Certis USA LLC - Overview
                • Certis USA LLC - Product / Service
                • Certis USA LLC - Key offerings
                • SWOT
              • 15.9 Corteva Inc.
                • Corteva Inc. - Overview
                • Corteva Inc. - Business segments
                • Corteva Inc. - Key news
                • Corteva Inc. - Key offerings
                • Corteva Inc. - Segment focus
                • SWOT
              • 15.10 Emnz
                • Emnz - Overview
                • Emnz - Product / Service
                • Emnz - Key offerings
                • SWOT
              • 15.11 Isagro Spa
                • Isagro Spa - Overview
                • Isagro Spa - Product / Service
                • Isagro Spa - Key offerings
                • SWOT
              • 15.12 Koppert Biological Systems
                • Koppert Biological Systems - Overview
                • Koppert Biological Systems - Product / Service
                • Koppert Biological Systems - Key offerings
                • SWOT
              • 15.13 Lallemand Inc.
                • Lallemand Inc. - Overview
                • Lallemand Inc. - Product / Service
                • Lallemand Inc. - Key news
                • Lallemand Inc. - Key offerings
                • SWOT
              • 15.14 Novonesis Group
                • Novonesis Group - Overview
                • Novonesis Group - Product / Service
                • Novonesis Group - Key offerings
                • SWOT
              • 15.15 Sumitomo Chemical Co. Ltd.
                • Sumitomo Chemical Co. Ltd. - Overview
                • Sumitomo Chemical Co. Ltd. - Business segments
                • Sumitomo Chemical Co. Ltd. - Key offerings
                • Sumitomo Chemical Co. Ltd. - Segment focus
                • SWOT
              • 15.16 Syngenta Crop Protection AG
                • Syngenta Crop Protection AG - Overview
                • Syngenta Crop Protection AG - Product / Service
                • Syngenta Crop Protection AG - Key offerings
                • SWOT
              • 15.17 UPL Ltd.
                • UPL Ltd. - Overview
                • UPL Ltd. - Business segments
                • UPL Ltd. - Key offerings
                • UPL Ltd. - Segment focus
                • SWOT
              • 15.18 Verdesian Life Sciences LLC
                • Verdesian Life Sciences LLC - Overview
                • Verdesian Life Sciences LLC - Product / Service
                • Verdesian Life Sciences LLC - Key offerings
                • SWOT

              16 Appendix

              • 16.1 Scope of the report
                • 16.2 Inclusions and exclusions checklist
                  • Inclusions checklist
                  • Exclusions checklist
                • 16.3 Currency conversion rates for US$
                  • Currency conversion rates for US$
                • 16.4 Research methodology
                  • Research methodology
                • 16.5 Data procurement
                  • Information sources
                • 16.6 Data validation
                  • Data validation
                • 16.7 Validation techniques employed for market sizing
                  • Validation techniques employed for market sizing
                • 16.8 Data synthesis
                  • Data synthesis
                • 16.9 360 degree market analysis
                  • 360 degree market analysis
                • 16.10 List of abbreviations
                  • List of abbreviations

                Research Methodology

                Technavio presents a detailed picture of the market by way of study, synthesis, and summation of data from multiple sources. The analysts have presented the various facets of the market with a particular focus on identifying the key industry influencers. The data thus presented is comprehensive, reliable, and the result of extensive research, both primary and secondary.

                INFORMATION SOURCES

                Primary sources

                • Manufacturers and suppliers
                • Channel partners
                • Industry experts
                • Strategic decision makers

                Secondary sources

                • Industry journals and periodicals
                • Government data
                • Financial reports of key industry players
                • Historical data
                • Press releases

                DATA ANALYSIS

                Data Synthesis

                • Collation of data
                • Estimation of key figures
                • Analysis of derived insights

                Data Validation

                • Triangulation with data models
                • Reference against proprietary databases
                • Corroboration with industry experts

                REPORT WRITING

                Qualitative

                • Market drivers
                • Market challenges
                • Market trends
                • Five forces analysis

                Quantitative

                • Market size and forecast
                • Market segmentation
                • Geographical insights
                • Competitive landscape

                Interested in this report?

                Get your sample now to see our research methodology and insights!

                Download Now

                Frequently Asked Questions

                Agricultural Microbials market growth will increase by $ 7988.3 mn during 2025-2029.

                The Agricultural Microbials market is expected to grow at a CAGR of 20.3% during 2025-2029.

                Agricultural Microbials market is segmented by Crop Type( Cereals and grains, Oilseeds and pulses, Fruits and vegetables, Others) Type( Soil amendment, Crop protection, APAC, South America, Middle East and Africa) Product Specification( Bacteria, Fungi, Virus, Protozoa, Others)

                AgBiome Inc., AGRICULTURE SOLUTIONS INC., Arysta LifeScience Corp., BASF SE, Bayer AG, Biomar Microbial Technologies, Certis USA LLC, Corteva Inc., Emnz, Isagro Spa, Koppert Biological Systems, Lallemand Inc., LOCUS AG SOLUTIONS, Novonesis Group, Sumitomo Chemical Co. Ltd., Syngenta Crop Protection AG, UPL Ltd., Verdesian Life Sciences LLC are a few of the key vendors in the Agricultural Microbials market.

                North America will register the highest growth rate of 55% among the other regions. Therefore, the Agricultural Microbials market in North America is expected to garner significant business opportunities for the vendors during the forecast period.

                US, Germany, China, UK, Canada, France, Italy, Japan, India, South Korea

                • Growing adoption of organic farmingThe increasing world population puts considerable pressure on land and various other natural resources. The accelerated rate of crop production leads to rapid loss of plant nutrients is the driving factor this market.
                • thereby impacting nutrient content in crops. Thus is the driving factor this market.
                • most farmers resort to the use of various chemicals and inorganic fertilizers to help replenish the loss of nutrients. However is the driving factor this market.
                • excessive use of chemical fertilizers has been found to decelerate the biological activities in the soil is the driving factor this market.
                • leading to impaired soil quality. As a result is the driving factor this market.
                • farmers are gradually moving toward a more sustainable farming option is the driving factor this market.
                • such as organic farming.The organic farming industry is growing with increasing awareness about health hazards associated with the use of chemicals in food products. As a result is the driving factor this market.
                • the global organic farming market is expected to reach $130 million by 2026. Globally is the driving factor this market.
                • the total agricultural land used for organic farming annually is over 60 million hectares. As compared to synthetic fertilizers is the driving factor this market.
                • agricultural microbials are a sustainable means to enhance crop growth and durability while maintaining soil fertility and sustainability with negligible environmental consequences.Government initiatives also support organic farming. For instance is the driving factor this market.
                • in India is the driving factor this market.
                • NMSA started the Paramparagat Krishi Vikas Yojana in 2015 is the driving factor this market.
                • which promotes commercial organic production through certified organic farming. This project further aims to achieve pesticide residue-free produce. Such initiatives will encourage farmers to adopt practices involved in organic farming is the driving factor this market.
                • such as using agricultural microbials. Such factors will thus lead to market growth during the forecast period. is the driving factor this market.

                The Agricultural Microbials market vendors should focus on grabbing business opportunities from the Cereals and grains segment as it accounted for the largest market share in the base year.