Agricultural Equipment Finance Market Analysis, Size, and Forecast 2026-2030: APAC (China, Japan, and India), North America (US, Canada, and Mexico), Europe (Germany, UK, and France), South America (Brazil, Argentina, and Colombia), Middle East and Africa (Saudi Arabia, UAE, and South Africa), and Rest of World (ROW)

Agricultural Equipment Finance Market Analysis, Size, and Forecast 2026-2030:
APAC (China, Japan, and India), North America (US, Canada, and Mexico), Europe (Germany, UK, and France), South America (Brazil, Argentina, and Colombia), Middle East and Africa (Saudi Arabia, UAE, and South Africa), and Rest of World (ROW)

Published: Dec 2025 300 Pages SKU: IRTNTR71878

Market Overview at a Glance

$58.46 B
Market Opportunity
6.5%
CAGR 2025 - 2030
44.1%
APAC Growth
$108.50 B
Lease segment 2024

Agricultural Equipment Finance Market Size 2026-2030

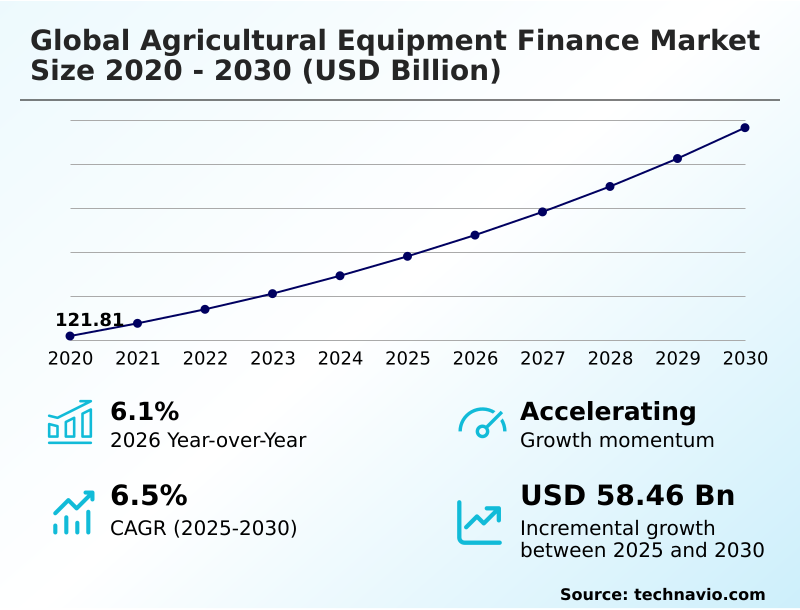
The agricultural equipment finance market size is valued to increase by USD 58.46 billion, at a CAGR of 6.5% from 2025 to 2030. Quick and easy access to credit will drive the agricultural equipment finance market.

Major Market Trends & Insights

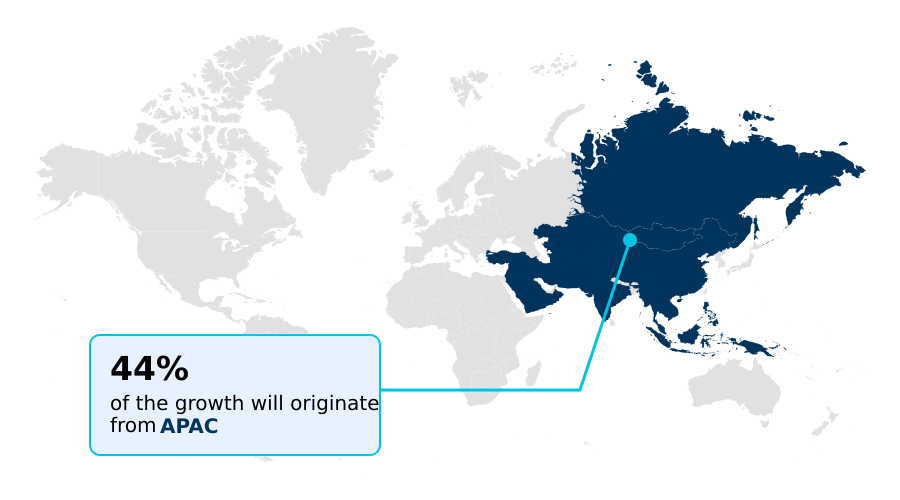
  • APAC dominated the market and accounted for a 44.1% growth during the forecast period.
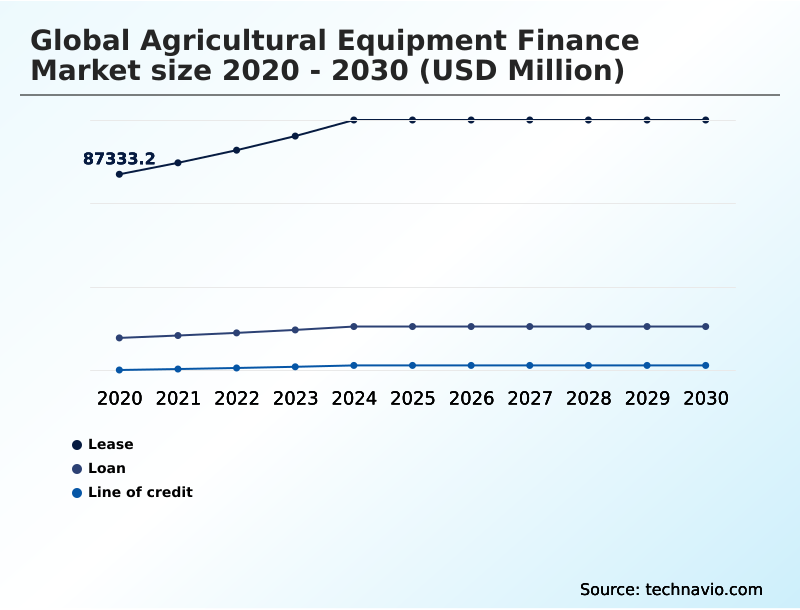
  • By Type - Lease segment was valued at USD 108.50 billion in 2024
  • By Product - Tractors segment accounted for the largest market revenue share in 2024

Market Size & Forecast

  • Market Opportunities: USD 94.70 billion
  • Market Future Opportunities: USD 58.46 billion
  • CAGR from 2025 to 2030 : 6.5%

Market Summary

  • The agricultural equipment finance market is undergoing a significant transformation, driven by the dual needs for enhanced productivity and operational sustainability. Key drivers include the digitalization of lending and the availability of government credit guarantee schemes, which improve access to capital for a wider range of producers.
  • A major trend is the shift from traditional ownership to access-based solutions, reflected in the popularity of operating lease agreements and emerging equipment-as-a-service models. This allows agribusinesses to adopt high-tech machinery without substantial upfront investment. However, challenges persist, including managing credit risk assessment in volatile commodity markets and navigating complex regulatory landscapes.
  • For instance, a large farming cooperative may utilize a blended finance model to acquire a fleet of autonomous harvesters, combining a commercial loan with a government grant for sustainable technology. This approach optimizes their debt service coverage while leveraging sustainability-linked lending to lower borrowing costs, demonstrating how sophisticated financial structuring is essential for modern agricultural competitiveness.

What will be the Size of the Agricultural Equipment Finance Market during the forecast period?

Get Key Insights on Market Forecast (PDF) Request Free Sample

How is the Agricultural Equipment Finance Market Segmented?

The agricultural equipment finance industry research report provides comprehensive data (region-wise segment analysis), with forecasts and estimates in "USD million" for the period 2026-2030, as well as historical data from 2020-2024 for the following segments.

  • Type
    • Lease
    • Loan
    • Line of credit
  • Product
    • Tractors
    • Harvesters
    • Haying equipment
    • Others
  • Area
    • Small farms
    • Medium farms
    • Large farms
  • Geography
    • APAC
      • China
      • Japan
      • India
    • North America
      • US
      • Canada
      • Mexico
    • Europe
      • Germany
      • UK
      • France
    • South America
      • Brazil
      • Argentina
      • Colombia
    • Middle East and Africa
      • Saudi Arabia
      • UAE
      • South Africa
    • Rest of World (ROW)

By Type Insights

The lease segment is estimated to witness significant growth during the forecast period.

The lease segment is increasingly pivotal, offering usership over ownership and mitigating the high capital costs of advanced machinery.

Through operating lease agreements, businesses can access cutting-edge technology, including autonomous machinery leasing, while transferring the residual value risk to the lessor. This structure is advantageous for managing cash flow and preserving credit lines for other operational needs.

Firms are leveraging sophisticated agreements like the terminal rental adjustment clause and even synthetic lease agreements in complex cross-border leasing structures. Unlike traditional debt financing or structured loan products, leasing supports faster technology adoption cycles.

This shift, which can improve a farm's reported liquidity ratios by over 15%, is pushing the industry toward equipment-as-a-service models and away from balance sheet liabilities, while also optimizing benefits from capital allowance schemes.

Request Free Sample

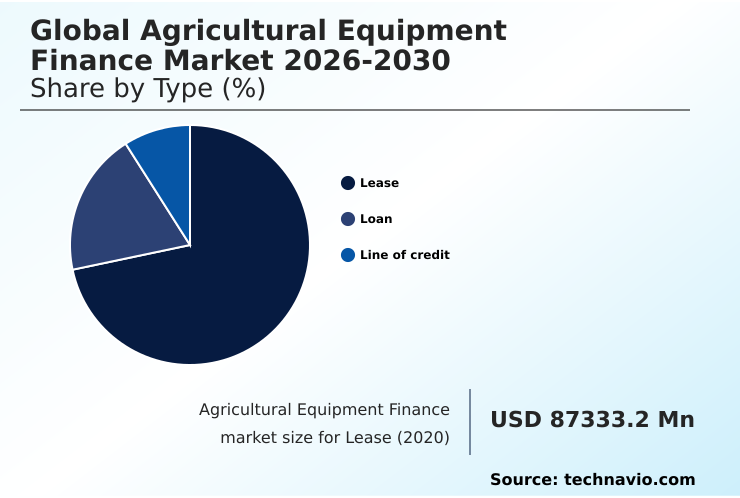
The Lease segment was valued at USD 108.50 billion in 2024 and showed a gradual increase during the forecast period.

Request Free Sample

Regional Analysis

APAC is estimated to contribute 44.1% to the growth of the global market during the forecast period.Technavio’s analysts have elaborately explained the regional trends and drivers that shape the market during the forecast period.

See How Agricultural Equipment Finance Market Demand is Rising in APAC Request Free Sample

The geographic landscape is highly varied, reflecting diverse economic conditions and agricultural practices. In North America, debt financing for large-scale operations is common, while cooperative funding models are prevalent in Europe.

APAC is seeing a surge in demand, contributing over 44% of the market's incremental growth, driven by mechanization in countries like India and China. South America utilizes unique mechanisms like payment-in-kind financing to hedge against currency volatility.

Across regions, lenders use metrics like debt service coverage to evaluate creditworthiness for everything from asset-based lending to complex multi-asset credit lines.

Specialized products such as floor plan lending for dealers and rental fleet financing are adapting to regional needs, with some entities utilizing tax-exempt financing for specific public-private projects.

Market Dynamics

Our researchers analyzed the data with 2025 as the base year, along with the key drivers, trends, and challenges. A holistic analysis of drivers will help companies refine their marketing strategies to gain a competitive advantage.

  • Strategic decision-making in agricultural finance requires a nuanced understanding of evolving equipment and credit landscapes. The debate over financing autonomous tractors versus traditional models highlights the industry's technological pivot, where lifecycle costs and software subscriptions are now key variables. For seasonal operations, leasing combines for seasonal harvesting cycles offers a capital-efficient alternative to ownership.
  • As technology becomes more integrated, demand for credit solutions for precision agriculture retrofits is growing, allowing farms to upgrade existing assets. The macroeconomic environment plays a critical role, as seen in the impact of interest rates on equipment loans. This is amplified by the fintech disruption in rural credit markets, which introduces new lending paradigms.
  • In volatile economies, risk mitigation in barter trade financing remains a vital tool. Lenders are developing new underwriting models for high-tech farm equipment and structuring loans for large farm consolidation to support industry trends.
  • Addressing the needs of smaller operations through asset-based lending for smallholder farmers and understanding the unique needs of financing strategies for agricultural technology startups are crucial for market inclusivity. The tax benefits of equipment leasing versus buying continue to be a major consideration, often amplified by dealer financing incentives for new machinery.
  • The secondary market also presents opportunities, necessitating clear strategies for financing options for used agricultural equipment. Furthermore, the integration of ESG criteria integration in agricultural lending is becoming standard practice, while optimizing cash flow with revolving credit lines remains a core financial strategy. The government subsidy impact on loan affordability can significantly alter purchasing decisions.
  • Advanced financial mechanisms, including emerging securitization trends in agricultural equipment loans and the use of digital platforms for small farm financing, are addressing longstanding issues.
  • Finally, navigating managing currency risk in cross-border financing and overcoming collateral challenges in emerging agricultural markets are essential for global operations, with successful strategies reducing credit-related losses by more than a third compared to traditional approaches.

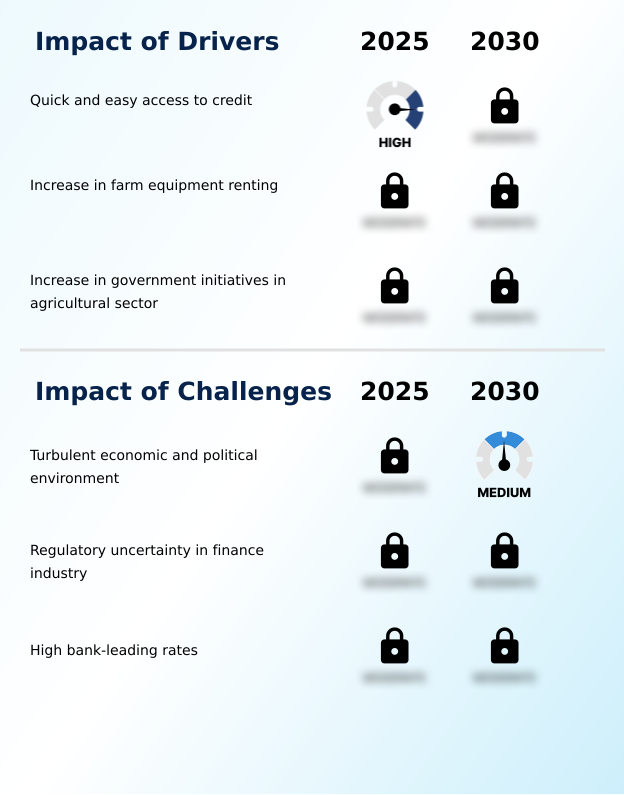
What are the key market drivers leading to the rise in the adoption of Agricultural Equipment Finance Industry?

  • Quick and easy access to credit, facilitated by digital platforms and alternative finance providers, serves as a key driver for market growth.

  • Government initiatives and a focus on sustainability are significant drivers. Programs offering interest rate subvention and credit guarantee schemes lower the entry barrier for acquiring modern machinery, increasing retail credit origination.
  • These supports enable investments in precision agriculture financing, which can boost crop yields by up to 20%.
  • The growing emphasis on ESG criteria has led to the expansion of green finance programs and sustainability-linked lending, providing preferential terms for eco-friendly equipment. Financial institutions are leveraging strong wholesale funding facilities to support these initiatives.
  • In developing regions, blended finance models and micro-lending schemes are crucial for providing access to working capital loans, while globally, a focus on digital efficiency is improving the entire credit lifecycle from origination to servicing.

What are the market trends shaping the Agricultural Equipment Finance Industry?

  • The modernization of agricultural equipment through the integration of advanced technologies is a primary trend shaping the market. This evolution is driving demand for innovative financing solutions that accommodate higher-value, technologically sophisticated machinery.

  • Market evolution is characterized by the adoption of advanced technologies that streamline credit delivery. The rise of fintech lending platforms is transforming access to capital, with some platforms reporting a 40% reduction in processing times through digital loan origination and automated underwriting engines.
  • These systems utilize AI-powered risk modeling and digital credit scoring to assess applicants who lack traditional credit histories. Concurrently, usage-based finance models and telematics-driven underwriting are gaining traction, aligning payment structures with actual equipment use. This innovation extends to transactional security, where blockchain-based contracts enhance transparency.
  • While traditional instruments like hire purchase contracts and revolving lines of credit remain relevant, the market is shifting toward more flexible and data-centric financial products that better serve modern agricultural needs.

What challenges does the Agricultural Equipment Finance Industry face during its growth?

  • A turbulent economic and political environment, characterized by market instability and regulatory shifts, presents a key challenge to the industry's growth trajectory.

  • Economic volatility and regulatory pressures create significant market challenges. Lenders face heightened complexity in credit risk assessment, with fluctuating asset values complicating collateral valuation models and tightening loan-to-value ratios. This environment can increase the rate of non-performing assets by over 5% in stressed regions, demanding robust portfolio risk management. Financiers employ predictive financial analytics to navigate these uncertainties.
  • The intricate processes behind the securitization of loans and asset securitization are also under scrutiny. Furthermore, specialized areas like dealer inventory financing and aftermarket parts financing are impacted by supply chain disruptions and shifting demand, requiring more dynamic and responsive risk frameworks to maintain market stability and liquidity.

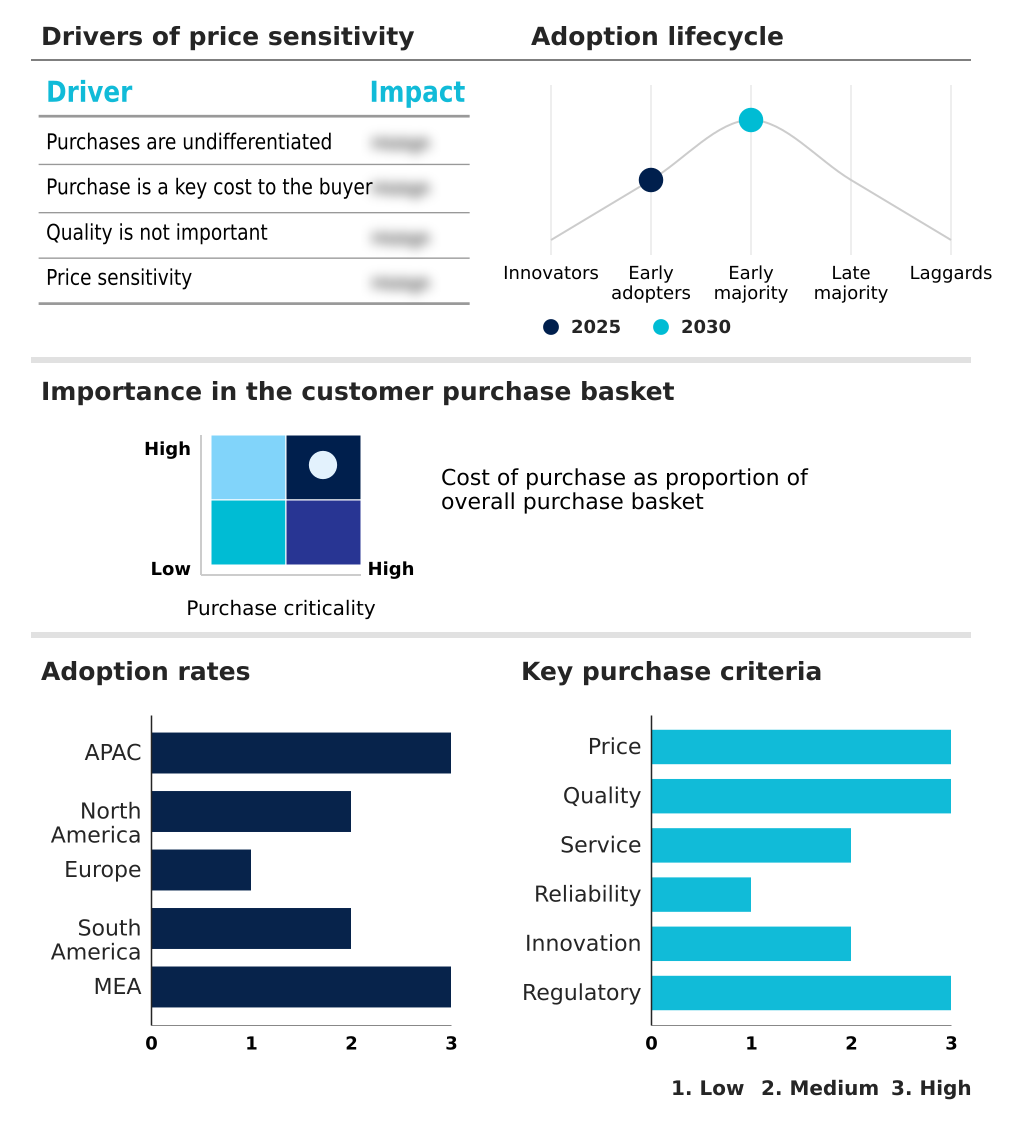
Exclusive Technavio Analysis on Customer Landscape

The agricultural equipment finance market forecasting report includes the adoption lifecycle of the market, covering from the innovator’s stage to the laggard’s stage. It focuses on adoption rates in different regions based on penetration. Furthermore, the agricultural equipment finance market report also includes key purchase criteria and drivers of price sensitivity to help companies evaluate and develop their market growth analysis strategies.

Customer Landscape of Agricultural Equipment Finance Industry

Competitive Landscape

Companies are implementing various strategies, such as strategic alliances, agricultural equipment finance market forecast, partnerships, mergers and acquisitions, geographical expansion, and product/service launches, to enhance their presence in the industry.

Adani Group - Delivers specialized agricultural equipment finance, including tractor loan services, through a dedicated capital subsidiary, targeting key rural credit needs.

The industry research and growth report includes detailed analyses of the competitive landscape of the market and information about key companies, including:

  • Adani Group
  • AGCO Corp.
  • Agricultural Bank of China Ltd.
  • Argo Tractors SpA
  • Barclays PLC
  • BlackRock Inc.
  • BNP Paribas SA
  • Citigroup Inc.
  • Deere and Co.
  • ICICI Bank Ltd.
  • IDFC FIRST Bank Ltd.
  • IndusInd Bank Ltd.
  • JPMorgan Chase and Co.
  • Key Corp.
  • Larsen and Toubro Ltd.
  • Mahindra and Mahindra Ltd.
  • Rabobank Group
  • State Bank of India
  • Wells Fargo and Co.

Qualitative and quantitative analysis of companies has been conducted to help clients understand the wider business environment as well as the strengths and weaknesses of key industry players. Data is qualitatively analyzed to categorize companies as pure play, category-focused, industry-focused, and diversified; it is quantitatively analyzed to categorize companies as dominant, leading, strong, tentative, and weak.

Recent Development and News in Agricultural equipment finance market

  • In April 2025, Deere and Co. introduced a pilot program for usage-based financing in North America, allowing agricultural producers to pay for autonomous machinery based on acreage covered rather than fixed monthly installments.
  • In May 2025, CNH Industrial announced an updated strategic business plan that pivots toward an 'Iron + Tech' approach, signaling a greater focus on precision technology and software as key value drivers for equipment financing.
  • In March 2025, AGCO Finance launched a strategic sustainability initiative, introducing a specialized loan program with reduced interest rates for mid-sized operators investing in equipment compatible with regenerative agriculture practices.
  • In March 2025, the United States Department of Agriculture announced a focused grant program aimed at subsidizing interest rates for precision agriculture equipment to encourage the adoption of sustainable farming practices among producers.

Dive into Technavio’s robust research methodology, blending expert interviews, extensive data synthesis, and validated models for unparalleled Agricultural Equipment Finance Market insights. See full methodology.

Market Scope
Page number 300
Base year 2025
Historic period 2020-2024
Forecast period 2026-2030
Growth momentum & CAGR Accelerate at a CAGR of 6.5%
Market growth 2026-2030 USD 58463.9 million
Market structure Fragmented
YoY growth 2025-2026(%) 6.1%
Key countries China, Japan, India, South Korea, Australia, Indonesia, US, Canada, Mexico, Germany, UK, France, Italy, Spain, The Netherlands, Brazil, Argentina, Colombia, Saudi Arabia, UAE, South Africa, Turkey and Israel
Competitive landscape Leading Companies, Market Positioning of Companies, Competitive Strategies, and Industry Risks

Request Free Sample

Research Analyst Overview

  • The agricultural equipment finance market is evolving beyond simple transactions into a complex ecosystem of structured financial solutions. Boardroom decisions are increasingly focused on leveraging finance to manage technological obsolescence and operational risk. Instruments like operating lease agreements and hire purchase contracts are being complemented by sophisticated structured loan products.
  • Effective credit risk assessment now relies on advanced collateral valuation models to manage loan-to-value ratios and mitigate residual value risk. Lenders are optimizing amortization schedules for various forms of debt financing, including working capital loans and revolving lines of credit.
  • To maintain liquidity, institutions utilize wholesale funding facilities and explore the securitization of loans, while government credit guarantee schemes and interest rate subvention programs influence retail credit origination. In certain regions, payment-in-kind financing offers a hedge against currency volatility.
  • The rise of fintech lending platforms using digital credit scoring and blockchain-based contracts has enabled a 30% reduction in processing times, fundamentally altering how floor plan lending and asset-based lending are managed, thereby impacting the entire landscape of non-performing assets and debt service coverage.

What are the Key Data Covered in this Agricultural Equipment Finance Market Research and Growth Report?

  • What is the expected growth of the Agricultural Equipment Finance Market between 2026 and 2030?

    • USD 58.46 billion, at a CAGR of 6.5%

  • What segmentation does the market report cover?

    • The report is segmented by Type (Lease, Loan, and Line of credit), Product (Tractors, Harvesters, Haying equipment, and Others), Area (Small farms, Medium farms, and Large farms) and Geography (APAC, North America, Europe, South America, Middle East and Africa)

  • Which regions are analyzed in the report?

    • APAC, North America, Europe, South America and Middle East and Africa

  • What are the key growth drivers and market challenges?

    • Quick and easy access to credit, Turbulent economic and political environment

  • Who are the major players in the Agricultural Equipment Finance Market?

    • Adani Group, AGCO Corp., Agricultural Bank of China Ltd., Argo Tractors SpA, Barclays PLC, BlackRock Inc., BNP Paribas SA, Citigroup Inc., Deere and Co., ICICI Bank Ltd., IDFC FIRST Bank Ltd., IndusInd Bank Ltd., JPMorgan Chase and Co., Key Corp., Larsen and Toubro Ltd., Mahindra and Mahindra Ltd., Rabobank Group, State Bank of India and Wells Fargo and Co.

Market Research Insights

  • The market's dynamism is driven by technological integration and innovative financial products. The adoption of telematics-driven underwriting has enabled some lenders to reduce default rates by up to 15% by using real-time equipment data. Usage-based finance models are reshaping asset acquisition, aligning costs directly with operational output.
  • The expansion of green finance programs offers tangible benefits, with producers securing interest rate reductions of 50 basis points for investing in low-emission machinery. Furthermore, AI-powered risk modeling and automated underwriting engines are accelerating credit decisions, with approval times in certain segments being cut in half.
  • These advancements, combined with digital loan origination and sophisticated portfolio risk management, are creating a more efficient, responsive, and data-centric financing ecosystem that supports both lender stability and agricultural productivity.

We can help! Our analysts can customize this agricultural equipment finance market research report to meet your requirements.

Get in touch

1. Executive Summary

1.1 Market overview

Executive Summary - Chart on Market Overview
Executive Summary - Data Table on Market Overview
Executive Summary - Chart on Global Market Characteristics
Executive Summary - Chart on Market by Geography
Executive Summary - Chart on Market Segmentation by Type
Executive Summary - Chart on Market Segmentation by Product
Executive Summary - Chart on Market Segmentation by Area
Executive Summary - Chart on Incremental Growth
Executive Summary - Data Table on Incremental Growth
Executive Summary - Chart on Company Market Positioning

2. Technavio Analysis

2.1 Analysis of price sensitivity, lifecycle, customer purchase basket, adoption rates, and purchase criteria

2.2 Criticality of inputs and Factors of differentiation

Chart on Overview on criticality of inputs and factors of differentiation

2.3 Factors of disruption

Chart on Overview on factors of disruption

2.4 Impact of drivers and challenges

Chart on Impact of drivers and challenges in 2025 and 2030

3. Market Landscape

3.1 Market ecosystem

Chart on Parent Market
Data Table on - Parent Market

3.2 Market characteristics

Chart on Market characteristics analysis

3.3 Value chain analysis

Chart on Value chain analysis

4. Market Sizing

4.1 Market definition

Data Table on Offerings of companies included in the market definition

4.2 Market segment analysis

Market segments

4.3 Market size 2025

4.4 Market outlook: Forecast for 2025-2030

Chart on Global - Market size and forecast 2025-2030 ($ million)
Data Table on Global - Market size and forecast 2025-2030 ($ million)
Chart on Global Market: Year-over-year growth 2025-2030 (%)
Data Table on Global Market: Year-over-year growth 2025-2030 (%)

5. Historic Market Size

5.1 Global Agricultural Equipment Finance Market 2020 - 2024

Historic Market Size - Data Table on Global Agricultural Equipment Finance Market 2020 - 2024 ($ million)

5.2 Type segment analysis 2020 - 2024

Historic Market Size - Type Segment 2020 - 2024 ($ million)

5.3 Product segment analysis 2020 - 2024

Historic Market Size - Product Segment 2020 - 2024 ($ million)

5.4 Area segment analysis 2020 - 2024

Historic Market Size - Area Segment 2020 - 2024 ($ million)

5.5 Geography segment analysis 2020 - 2024

Historic Market Size - Geography Segment 2020 - 2024 ($ million)

5.6 Country segment analysis 2020 - 2024

Historic Market Size - Country Segment 2020 - 2024 ($ million)

6. Qualitative Analysis

6.1 Impact of AI in global agricultural equipment finance market

7. Five Forces Analysis

7.1 Five forces summary

Five forces analysis - Comparison between 2025 and 2030

7.2 Bargaining power of buyers

Bargaining power of buyers - Impact of key factors 2025 and 2030

7.3 Bargaining power of suppliers

Bargaining power of suppliers - Impact of key factors in 2025 and 2030

7.4 Threat of new entrants

Threat of new entrants - Impact of key factors in 2025 and 2030

7.5 Threat of substitutes

Threat of substitutes - Impact of key factors in 2025 and 2030

7.6 Threat of rivalry

Threat of rivalry - Impact of key factors in 2025 and 2030

7.7 Market condition

Chart on Market condition - Five forces 2025 and 2030

8. Market Segmentation by Type

8.1 Market segments

Chart on Type - Market share 2025-2030 (%)
Data Table on Type - Market share 2025-2030 (%)

8.2 Comparison by Type

Chart on Comparison by Type
Data Table on Comparison by Type

8.3 Lease - Market size and forecast 2025-2030

Chart on Lease - Market size and forecast 2025-2030 ($ million)
Data Table on Lease - Market size and forecast 2025-2030 ($ million)
Chart on Lease - Year-over-year growth 2025-2030 (%)
Data Table on Lease - Year-over-year growth 2025-2030 (%)

8.4 Loan - Market size and forecast 2025-2030

Chart on Loan - Market size and forecast 2025-2030 ($ million)
Data Table on Loan - Market size and forecast 2025-2030 ($ million)
Chart on Loan - Year-over-year growth 2025-2030 (%)
Data Table on Loan - Year-over-year growth 2025-2030 (%)

8.5 Line of credit - Market size and forecast 2025-2030

Chart on Line of credit - Market size and forecast 2025-2030 ($ million)
Data Table on Line of credit - Market size and forecast 2025-2030 ($ million)
Chart on Line of credit - Year-over-year growth 2025-2030 (%)
Data Table on Line of credit - Year-over-year growth 2025-2030 (%)

8.6 Market opportunity by Type

Market opportunity by Type ($ million)
Data Table on Market opportunity by Type ($ million)

9. Market Segmentation by Product

9.1 Market segments

Chart on Product - Market share 2025-2030 (%)
Data Table on Product - Market share 2025-2030 (%)

9.2 Comparison by Product

Chart on Comparison by Product
Data Table on Comparison by Product

9.3 Tractors - Market size and forecast 2025-2030

Chart on Tractors - Market size and forecast 2025-2030 ($ million)
Data Table on Tractors - Market size and forecast 2025-2030 ($ million)
Chart on Tractors - Year-over-year growth 2025-2030 (%)
Data Table on Tractors - Year-over-year growth 2025-2030 (%)

9.4 Harvesters - Market size and forecast 2025-2030

Chart on Harvesters - Market size and forecast 2025-2030 ($ million)
Data Table on Harvesters - Market size and forecast 2025-2030 ($ million)
Chart on Harvesters - Year-over-year growth 2025-2030 (%)
Data Table on Harvesters - Year-over-year growth 2025-2030 (%)

9.5 Haying equipment - Market size and forecast 2025-2030

Chart on Haying equipment - Market size and forecast 2025-2030 ($ million)
Data Table on Haying equipment - Market size and forecast 2025-2030 ($ million)
Chart on Haying equipment - Year-over-year growth 2025-2030 (%)
Data Table on Haying equipment - Year-over-year growth 2025-2030 (%)

9.6 Others - Market size and forecast 2025-2030

Chart on Others - Market size and forecast 2025-2030 ($ million)
Data Table on Others - Market size and forecast 2025-2030 ($ million)
Chart on Others - Year-over-year growth 2025-2030 (%)
Data Table on Others - Year-over-year growth 2025-2030 (%)

9.7 Market opportunity by Product

Market opportunity by Product ($ million)
Data Table on Market opportunity by Product ($ million)

10. Market Segmentation by Area

10.1 Market segments

Chart on Area - Market share 2025-2030 (%)
Data Table on Area - Market share 2025-2030 (%)

10.2 Comparison by Area

Chart on Comparison by Area
Data Table on Comparison by Area

10.3 Small farms - Market size and forecast 2025-2030

Chart on Small farms - Market size and forecast 2025-2030 ($ million)
Data Table on Small farms - Market size and forecast 2025-2030 ($ million)
Chart on Small farms - Year-over-year growth 2025-2030 (%)
Data Table on Small farms - Year-over-year growth 2025-2030 (%)

10.4 Medium farms - Market size and forecast 2025-2030

Chart on Medium farms - Market size and forecast 2025-2030 ($ million)
Data Table on Medium farms - Market size and forecast 2025-2030 ($ million)
Chart on Medium farms - Year-over-year growth 2025-2030 (%)
Data Table on Medium farms - Year-over-year growth 2025-2030 (%)

10.5 Large farms - Market size and forecast 2025-2030

Chart on Large farms - Market size and forecast 2025-2030 ($ million)
Data Table on Large farms - Market size and forecast 2025-2030 ($ million)
Chart on Large farms - Year-over-year growth 2025-2030 (%)
Data Table on Large farms - Year-over-year growth 2025-2030 (%)

10.6 Market opportunity by Area

Market opportunity by Area ($ million)
Data Table on Market opportunity by Area ($ million)

11. Customer Landscape

11.1 Customer landscape overview

Analysis of price sensitivity, lifecycle, customer purchase basket, adoption rates, and purchase criteria

12. Geographic Landscape

12.1 Geographic segmentation

Chart on Market share by geography 2025-2030 (%)
Data Table on Market share by geography 2025-2030 (%)

12.2 Geographic comparison

Chart on Geographic comparison
Data Table on Geographic comparison

12.3 APAC - Market size and forecast 2025-2030

Chart on APAC - Market size and forecast 2025-2030 ($ million)
Data Table on APAC - Market size and forecast 2025-2030 ($ million)
Chart on APAC - Year-over-year growth 2025-2030 (%)
Data Table on APAC - Year-over-year growth 2025-2030 (%)
Chart on Regional Comparison - APAC
Data Table on Regional Comparison - APAC

12.3.1 China - Market size and forecast 2025-2030

Chart on China - Market size and forecast 2025-2030 ($ million)
Data Table on China - Market size and forecast 2025-2030 ($ million)
Chart on China - Year-over-year growth 2025-2030 (%)
Data Table on China - Year-over-year growth 2025-2030 (%)

12.3.2 Japan - Market size and forecast 2025-2030

Chart on Japan - Market size and forecast 2025-2030 ($ million)
Data Table on Japan - Market size and forecast 2025-2030 ($ million)
Chart on Japan - Year-over-year growth 2025-2030 (%)
Data Table on Japan - Year-over-year growth 2025-2030 (%)

12.3.3 India - Market size and forecast 2025-2030

Chart on India - Market size and forecast 2025-2030 ($ million)
Data Table on India - Market size and forecast 2025-2030 ($ million)
Chart on India - Year-over-year growth 2025-2030 (%)
Data Table on India - Year-over-year growth 2025-2030 (%)

12.3.4 South Korea - Market size and forecast 2025-2030

Chart on South Korea - Market size and forecast 2025-2030 ($ million)
Data Table on South Korea - Market size and forecast 2025-2030 ($ million)
Chart on South Korea - Year-over-year growth 2025-2030 (%)
Data Table on South Korea - Year-over-year growth 2025-2030 (%)

12.3.5 Australia - Market size and forecast 2025-2030

Chart on Australia - Market size and forecast 2025-2030 ($ million)
Data Table on Australia - Market size and forecast 2025-2030 ($ million)
Chart on Australia - Year-over-year growth 2025-2030 (%)
Data Table on Australia - Year-over-year growth 2025-2030 (%)

12.3.6 Indonesia - Market size and forecast 2025-2030

Chart on Indonesia - Market size and forecast 2025-2030 ($ million)
Data Table on Indonesia - Market size and forecast 2025-2030 ($ million)
Chart on Indonesia - Year-over-year growth 2025-2030 (%)
Data Table on Indonesia - Year-over-year growth 2025-2030 (%)

12.4 North America - Market size and forecast 2025-2030

Chart on North America - Market size and forecast 2025-2030 ($ million)
Data Table on North America - Market size and forecast 2025-2030 ($ million)
Chart on North America - Year-over-year growth 2025-2030 (%)
Data Table on North America - Year-over-year growth 2025-2030 (%)
Chart on Regional Comparison - North America
Data Table on Regional Comparison - North America

12.4.1 US - Market size and forecast 2025-2030

Chart on US - Market size and forecast 2025-2030 ($ million)
Data Table on US - Market size and forecast 2025-2030 ($ million)
Chart on US - Year-over-year growth 2025-2030 (%)
Data Table on US - Year-over-year growth 2025-2030 (%)

12.4.2 Canada - Market size and forecast 2025-2030

Chart on Canada - Market size and forecast 2025-2030 ($ million)
Data Table on Canada - Market size and forecast 2025-2030 ($ million)
Chart on Canada - Year-over-year growth 2025-2030 (%)
Data Table on Canada - Year-over-year growth 2025-2030 (%)

12.4.3 Mexico - Market size and forecast 2025-2030

Chart on Mexico - Market size and forecast 2025-2030 ($ million)
Data Table on Mexico - Market size and forecast 2025-2030 ($ million)
Chart on Mexico - Year-over-year growth 2025-2030 (%)
Data Table on Mexico - Year-over-year growth 2025-2030 (%)

12.5 Europe - Market size and forecast 2025-2030

Chart on Europe - Market size and forecast 2025-2030 ($ million)
Data Table on Europe - Market size and forecast 2025-2030 ($ million)
Chart on Europe - Year-over-year growth 2025-2030 (%)
Data Table on Europe - Year-over-year growth 2025-2030 (%)
Chart on Regional Comparison - Europe
Data Table on Regional Comparison - Europe

12.5.1 Germany - Market size and forecast 2025-2030

Chart on Germany - Market size and forecast 2025-2030 ($ million)
Data Table on Germany - Market size and forecast 2025-2030 ($ million)
Chart on Germany - Year-over-year growth 2025-2030 (%)
Data Table on Germany - Year-over-year growth 2025-2030 (%)

12.5.2 UK - Market size and forecast 2025-2030

Chart on UK - Market size and forecast 2025-2030 ($ million)
Data Table on UK - Market size and forecast 2025-2030 ($ million)
Chart on UK - Year-over-year growth 2025-2030 (%)
Data Table on UK - Year-over-year growth 2025-2030 (%)

12.5.3 France - Market size and forecast 2025-2030

Chart on France - Market size and forecast 2025-2030 ($ million)
Data Table on France - Market size and forecast 2025-2030 ($ million)
Chart on France - Year-over-year growth 2025-2030 (%)
Data Table on France - Year-over-year growth 2025-2030 (%)

12.5.4 Italy - Market size and forecast 2025-2030

Chart on Italy - Market size and forecast 2025-2030 ($ million)
Data Table on Italy - Market size and forecast 2025-2030 ($ million)
Chart on Italy - Year-over-year growth 2025-2030 (%)
Data Table on Italy - Year-over-year growth 2025-2030 (%)

12.5.5 Spain - Market size and forecast 2025-2030

Chart on Spain - Market size and forecast 2025-2030 ($ million)
Data Table on Spain - Market size and forecast 2025-2030 ($ million)
Chart on Spain - Year-over-year growth 2025-2030 (%)
Data Table on Spain - Year-over-year growth 2025-2030 (%)

12.5.6 The Netherlands - Market size and forecast 2025-2030

Chart on The Netherlands - Market size and forecast 2025-2030 ($ million)
Data Table on The Netherlands - Market size and forecast 2025-2030 ($ million)
Chart on The Netherlands - Year-over-year growth 2025-2030 (%)
Data Table on The Netherlands - Year-over-year growth 2025-2030 (%)

12.6 South America - Market size and forecast 2025-2030

Chart on South America - Market size and forecast 2025-2030 ($ million)
Data Table on South America - Market size and forecast 2025-2030 ($ million)
Chart on South America - Year-over-year growth 2025-2030 (%)
Data Table on South America - Year-over-year growth 2025-2030 (%)
Chart on Regional Comparison - South America
Data Table on Regional Comparison - South America

12.6.1 Brazil - Market size and forecast 2025-2030

Chart on Brazil - Market size and forecast 2025-2030 ($ million)
Data Table on Brazil - Market size and forecast 2025-2030 ($ million)
Chart on Brazil - Year-over-year growth 2025-2030 (%)
Data Table on Brazil - Year-over-year growth 2025-2030 (%)

12.6.2 Argentina - Market size and forecast 2025-2030

Chart on Argentina - Market size and forecast 2025-2030 ($ million)
Data Table on Argentina - Market size and forecast 2025-2030 ($ million)
Chart on Argentina - Year-over-year growth 2025-2030 (%)
Data Table on Argentina - Year-over-year growth 2025-2030 (%)

12.6.3 Colombia - Market size and forecast 2025-2030

Chart on Colombia - Market size and forecast 2025-2030 ($ million)
Data Table on Colombia - Market size and forecast 2025-2030 ($ million)
Chart on Colombia - Year-over-year growth 2025-2030 (%)
Data Table on Colombia - Year-over-year growth 2025-2030 (%)

12.7 Middle East and Africa - Market size and forecast 2025-2030

Chart on Middle East and Africa - Market size and forecast 2025-2030 ($ million)
Data Table on Middle East and Africa - Market size and forecast 2025-2030 ($ million)
Chart on Middle East and Africa - Year-over-year growth 2025-2030 (%)
Data Table on Middle East and Africa - Year-over-year growth 2025-2030 (%)
Chart on Regional Comparison - Middle East and Africa
Data Table on Regional Comparison - Middle East and Africa

12.7.1 Saudi Arabia - Market size and forecast 2025-2030

Chart on Saudi Arabia - Market size and forecast 2025-2030 ($ million)
Data Table on Saudi Arabia - Market size and forecast 2025-2030 ($ million)
Chart on Saudi Arabia - Year-over-year growth 2025-2030 (%)
Data Table on Saudi Arabia - Year-over-year growth 2025-2030 (%)

12.7.2 UAE - Market size and forecast 2025-2030

Chart on UAE - Market size and forecast 2025-2030 ($ million)
Data Table on UAE - Market size and forecast 2025-2030 ($ million)
Chart on UAE - Year-over-year growth 2025-2030 (%)
Data Table on UAE - Year-over-year growth 2025-2030 (%)

12.7.3 South Africa - Market size and forecast 2025-2030

Chart on South Africa - Market size and forecast 2025-2030 ($ million)
Data Table on South Africa - Market size and forecast 2025-2030 ($ million)
Chart on South Africa - Year-over-year growth 2025-2030 (%)
Data Table on South Africa - Year-over-year growth 2025-2030 (%)

12.7.4 Turkey - Market size and forecast 2025-2030

Chart on Turkey - Market size and forecast 2025-2030 ($ million)
Data Table on Turkey - Market size and forecast 2025-2030 ($ million)
Chart on Turkey - Year-over-year growth 2025-2030 (%)
Data Table on Turkey - Year-over-year growth 2025-2030 (%)

12.7.5 Israel - Market size and forecast 2025-2030

Chart on Israel - Market size and forecast 2025-2030 ($ million)
Data Table on Israel - Market size and forecast 2025-2030 ($ million)
Chart on Israel - Year-over-year growth 2025-2030 (%)
Data Table on Israel - Year-over-year growth 2025-2030 (%)

12.8 Market opportunity by geography

Market opportunity by geography ($ million)
Data Tables on Market opportunity by geography ($ million)

13. Drivers, Challenges, and Opportunity

13.1 Market drivers

Quick and easy access to credit
Increase in farm equipment renting
Increase in government initiatives in agricultural sector

13.2 Market challenges

Turbulent economic and political environment
Regulatory uncertainty in finance industry
High bank-leading rates

13.3 Impact of drivers and challenges

Impact of drivers and challenges in 2025 and 2030

13.4 Market opportunities

Modernization of agricultural equipment through advanced technologies
Advances in technology used by financial institutions
Financing to support women in agricultural sector

14. Competitive Landscape

14.1 Overview

14.2

Overview on criticality of inputs and factors of differentiation

14.3 Landscape disruption

Overview on factors of disruption

14.4 Industry risks

Impact of key risks on business

15. Competitive Analysis

15.1 Companies profiled

Companies covered

15.2 Company ranking index

15.3 Market positioning of companies

Matrix on companies position and classification

15.4 Adani Group

Adani Group - Overview
Adani Group - Product / Service
Adani Group - Key news
Adani Group - Key offerings
SWOT

15.5 Agricultural Bank of China Ltd.

Agricultural Bank of China Ltd. - Overview
Agricultural Bank of China Ltd. - Business segments
Agricultural Bank of China Ltd. - Key offerings
Agricultural Bank of China Ltd. - Segment focus
SWOT

15.6 Barclays PLC

Barclays PLC - Overview
Barclays PLC - Product / Service
Barclays PLC - Key offerings
SWOT

15.7 BNP Paribas SA

BNP Paribas SA - Overview
BNP Paribas SA - Business segments
BNP Paribas SA - Key news
BNP Paribas SA - Key offerings
BNP Paribas SA - Segment focus
SWOT

15.8 Citigroup Inc.

Citigroup Inc. - Overview
Citigroup Inc. - Business segments
Citigroup Inc. - Key news
Citigroup Inc. - Key offerings
Citigroup Inc. - Segment focus
SWOT

15.9 Deere and Co.

Deere and Co. - Overview
Deere and Co. - Business segments
Deere and Co. - Key news
Deere and Co. - Key offerings
Deere and Co. - Segment focus
SWOT

15.10 ICICI Bank Ltd.

ICICI Bank Ltd. - Overview
ICICI Bank Ltd. - Business segments
ICICI Bank Ltd. - Key offerings
ICICI Bank Ltd. - Segment focus
SWOT

15.11 IndusInd Bank Ltd.

IndusInd Bank Ltd. - Overview
IndusInd Bank Ltd. - Business segments
IndusInd Bank Ltd. - Key offerings
IndusInd Bank Ltd. - Segment focus
SWOT

15.12 JPMorgan Chase and Co.

JPMorgan Chase and Co. - Overview
JPMorgan Chase and Co. - Business segments
JPMorgan Chase and Co. - Key news
JPMorgan Chase and Co. - Key offerings
JPMorgan Chase and Co. - Segment focus
SWOT

15.13 Key Corp.

Key Corp. - Overview
Key Corp. - Business segments
Key Corp. - Key offerings
Key Corp. - Segment focus
SWOT

15.14 Larsen and Toubro Ltd.

Larsen and Toubro Ltd. - Overview
Larsen and Toubro Ltd. - Business segments
Larsen and Toubro Ltd. - Key offerings
Larsen and Toubro Ltd. - Segment focus
SWOT

15.15 Mahindra and Mahindra Ltd.

Mahindra and Mahindra Ltd. - Overview
Mahindra and Mahindra Ltd. - Business segments
Mahindra and Mahindra Ltd. - Key news
Mahindra and Mahindra Ltd. - Key offerings
Mahindra and Mahindra Ltd. - Segment focus
SWOT

15.16 Rabobank Group

Rabobank Group - Overview
Rabobank Group - Business segments
Rabobank Group - Key offerings
Rabobank Group - Segment focus
SWOT

15.17 State Bank of India

State Bank of India - Overview
State Bank of India - Business segments
State Bank of India - Key offerings
State Bank of India - Segment focus
SWOT

15.18 Wells Fargo and Co.

Wells Fargo and Co. - Overview
Wells Fargo and Co. - Business segments
Wells Fargo and Co. - Key offerings
Wells Fargo and Co. - Segment focus
SWOT

16. Appendix

16.1 Scope of the report

Market definition
Objectives
Notes and caveats

16.2 Inclusions and exclusions checklist

Inclusions checklist
Exclusions checklist

16.3 Currency conversion rates for US$

16.4 Research methodology

16.5 Data procurement

Information sources

16.6 Data validation

16.7 Validation techniques employed for market sizing

16.8 Data synthesis

16.9 360 degree market analysis

16.10 List of abbreviations

Research Methodology

Technavio presents a detailed picture of the market by way of study, synthesis, and summation of data from multiple sources. The analysts have presented the various facets of the market with a particular focus on identifying the key industry influencers. The data thus presented is comprehensive, reliable, and the result of extensive research, both primary and secondary.

INFORMATION SOURCES

Primary sources

  • Manufacturers and suppliers
  • Channel partners
  • Industry experts
  • Strategic decision makers

Secondary sources

  • Industry journals and periodicals
  • Government data
  • Financial reports of key industry players
  • Historical data
  • Press releases

DATA ANALYSIS

Data Synthesis

  • Collation of data
  • Estimation of key figures
  • Analysis of derived insights

Data Validation

  • Triangulation with data models
  • Reference against proprietary databases
  • Corroboration with industry experts

REPORT WRITING

Qualitative

  • Market drivers
  • Market challenges
  • Market trends
  • Five forces analysis

Quantitative

  • Market size and forecast
  • Market segmentation
  • Geographical insights
  • Competitive landscape

Interested in this report?

Get your sample now to see our research methodology and insights!

Download Now

Frequently Asked Questions

Agricultural Equipment Finance market growth will increase by USD 58463.9 million during 2026-2030.

The Agricultural Equipment Finance market is expected to grow at a CAGR of 6.5% during 2026-2030.

Agricultural Equipment Finance market is segmented by Type (Lease, Loan, Line of credit) Product (Tractors, Harvesters, Haying equipment, Others) Area (Small farms, Medium farms, Large farms)

Adani Group, AGCO Corp., Agricultural Bank of China Ltd., Argo Tractors SpA, Barclays PLC, BlackRock Inc., BNP Paribas SA, Citigroup Inc., Deere and Co., ICICI Bank Ltd., IDFC FIRST Bank Ltd., IndusInd Bank Ltd., JPMorgan Chase and Co., Key Corp., Larsen and Toubro Ltd., Mahindra and Mahindra Ltd., Rabobank Group, State Bank of India, Wells Fargo and Co. are a few of the key vendors in the Agricultural Equipment Finance market.

APAC will register the highest growth rate of 44.1% among the other regions. Therefore, the Agricultural Equipment Finance market in APAC is expected to garner significant business opportunities for the vendors during the forecast period.

China, Japan, India, South Korea, Australia, Indonesia, US, Canada, Mexico, Germany, UK, France, Italy, Spain, The Netherlands, Brazil, Argentina, Colombia, Saudi Arabia, UAE, South Africa, Turkey, Israel

  • Quick and easy access to credit is the driving factor this market.

The Agricultural Equipment Finance market vendors should focus on grabbing business opportunities from the Type segment as it accounted for the largest market share in the base year.