Advertising Services Market Analysis, Size, and Forecast 2025-2029: North America (US, Canada, and Mexico), APAC (China, India, and Japan), Europe (Germany, UK, and France), South America (Brazil, Argentina, and Colombia), Middle East and Africa (Saudi Arabia, UAE, and South Africa), and Rest of World (ROW)

Advertising Services Market Analysis, Size, and Forecast 2025-2029:
North America (US, Canada, and Mexico), APAC (China, India, and Japan), Europe (Germany, UK, and France), South America (Brazil, Argentina, and Colombia), Middle East and Africa (Saudi Arabia, UAE, and South Africa), and Rest of World (ROW)

Published: Dec 2025 309 Pages SKU: IRTNTR73436

Market Overview at a Glance

$166.4 B
Market Opportunity
4.4%
CAGR 2024 - 2029
38.4%
North America Growth
$336.3 B
Digital advertising segment 2023

Advertising Services Market Size 2025-2029

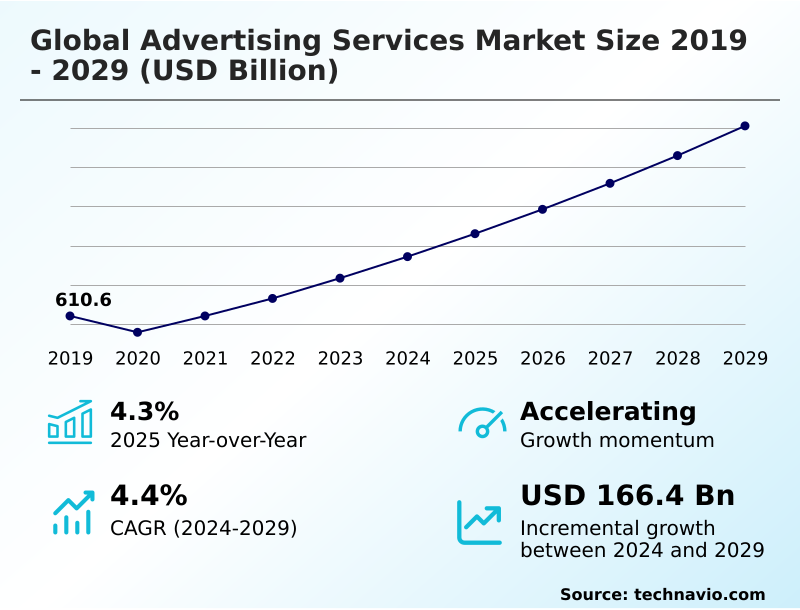
The advertising services market size is valued to increase by USD 166.4 billion, at a CAGR of 4.4% from 2024 to 2029. Accelerated digital transformation and ubiquity of connected devices will drive the advertising services market.

Major Market Trends & Insights

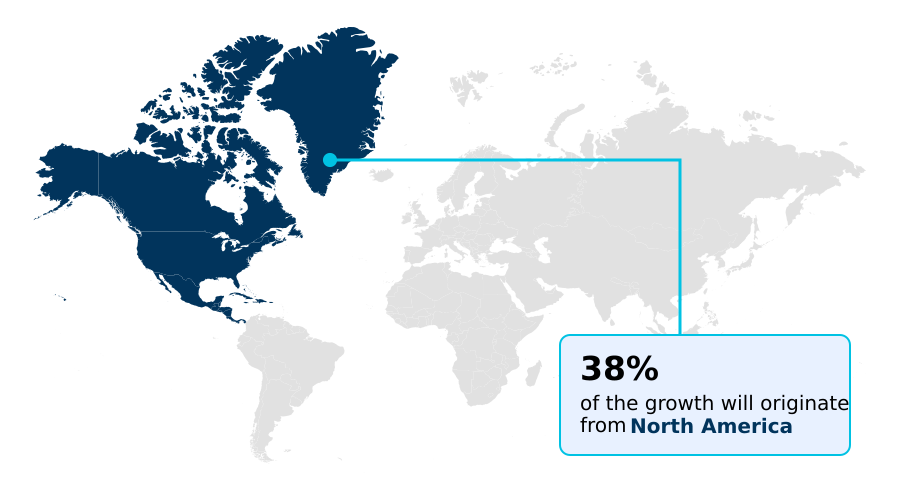
  • North America dominated the market and accounted for a 38.4% growth during the forecast period.
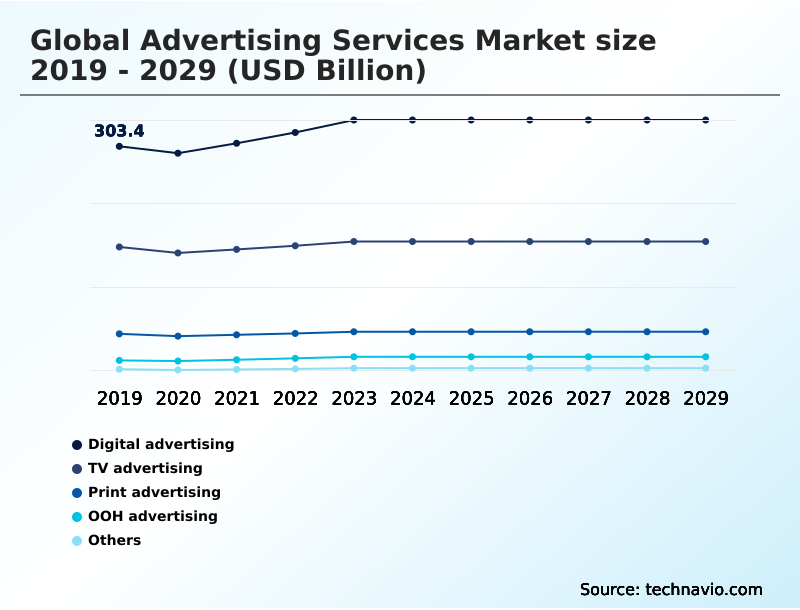
  • By Type - Digital advertising segment was valued at USD 336.3 billion in 2023
  • By Business Model - Online advertising segment accounted for the largest market revenue share in 2023

Market Size & Forecast

  • Market Opportunities: USD 241.9 billion
  • Market Future Opportunities: USD 166.4 billion
  • CAGR from 2024 to 2029 : 4.4%

Market Summary

  • The advertising services market is undergoing a significant transformation, driven by technological innovation and shifting consumer behaviors. The rise of retail media networks and the pervasive integration of generative AI are creating new efficiencies and channels for audience engagement. Organizations are leveraging these tools to automate creative production and deliver highly personalized campaigns at scale.
  • However, this evolution is taking place against the backdrop of third-party cookie deprecation, which is forcing a fundamental industry shift toward privacy-enhancing technologies and first-party data strategies.
  • A key business scenario involves consumer packaged goods companies using data clean rooms to collaborate with retailers, enriching their audience segmentation to launch more effective connected TV (CTV) campaigns without sharing personally identifiable information.
  • This approach balances the demand for performance marketing and measurable return on ad spend with the critical need for user consent management and brand safety, defining the market's complex but opportunity-rich landscape.

What will be the Size of the Advertising Services Market during the forecast period?

Get Key Insights on Market Forecast (PDF) Request Free Sample

How is the Advertising Services Market Segmented?

The advertising services industry research report provides comprehensive data (region-wise segment analysis), with forecasts and estimates in "USD billion" for the period 2025-2029, as well as historical data from 2019-2023 for the following segments.

  • Type
    • Digital advertising
    • TV advertising
    • Print advertising
    • OOH advertising
    • Others
  • Business model
    • Online advertising
    • Offline advertising
  • End-user
    • Consumer goods and retail
    • IT and telecom
    • Government and public sector
    • BFSI
    • Others
  • Geography
    • North America
      • US
      • Canada
      • Mexico
    • APAC
      • China
      • India
      • Japan
    • Europe
      • Germany
      • UK
      • France
    • South America
      • Brazil
      • Argentina
      • Colombia
    • Middle East and Africa
      • Saudi Arabia
      • UAE
      • South Africa
    • Rest of World (ROW)

By Type Insights

The digital advertising segment is estimated to witness significant growth during the forecast period.

The digital advertising segment is evolving beyond simple metrics, focusing on comprehensive performance marketing strategies that integrate social commerce and shoppable video ads.

Success is increasingly measured not just by click-through rate (CTR) but by the overall return on ad spend (ROAS) and the efficacy of personalized ad delivery.

Advanced geotargeting technology is crucial for local engagement, while a sophisticated campaign flighting strategy optimizes budget allocation over time. The integration of programmatic advertising with first-party data activation enables precise digital ad trafficking and supports closed-loop attribution models.

This shift allows for a more holistic view of customer journeys, with firms using advanced attribution modeling seeing a 20% higher accuracy in crediting touchpoints.

Request Free Sample

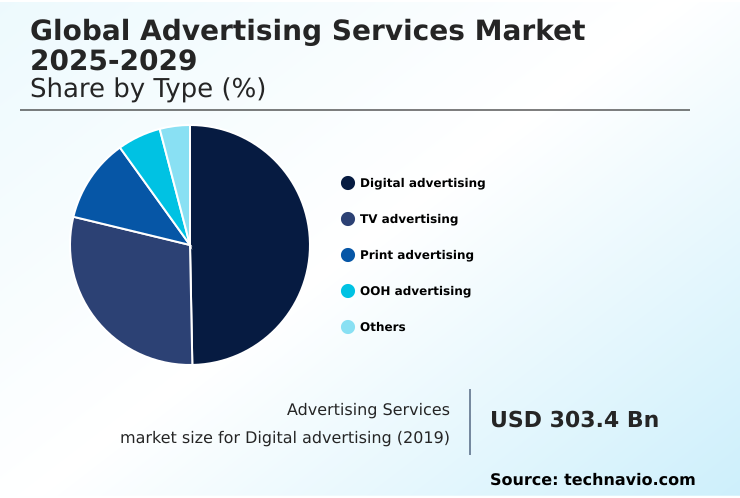
The Digital advertising segment was valued at USD 336.3 billion in 2023 and showed a gradual increase during the forecast period.

Request Free Sample

Regional Analysis

North America is estimated to contribute 38.4% to the growth of the global market during the forecast period.Technavio’s analysts have elaborately explained the regional trends and drivers that shape the market during the forecast period.

See How Advertising Services Market Demand is Rising in North America Request Free Sample

The geographic landscape reveals divergent adoption rates for advanced advertising technologies. In North America and Europe, the focus is on optimizing real-time bidding (RTB) through sophisticated header bidding setups and the use of programmatic direct deals for premium inventory.

These mature markets are leading the charge in implementing universal ID solutions to navigate a cookieless future.

In contrast, high-growth markets in APAC and South America are seeing rapid expansion in mobile-first channels like in-game advertising and ad-supported video-on-demand (AVOD), with programmatic audio ads showing 40% higher engagement during commute times.

Across all regions, the supply-side platform (SSP) and ad exchange platforms are central to inventory management, while the effectiveness of contextual targeting is being re-evaluated as a privacy-safe alternative.

This disparity requires a globally-minded yet locally-tuned approach, with predictive audience modeling adapting to regional data signals and consumer behaviors on both subscription video-on-demand (SVOD) and free platforms.

Market Dynamics

Our researchers analyzed the data with 2024 as the base year, along with the key drivers, trends, and challenges. A holistic analysis of drivers will help companies refine their marketing strategies to gain a competitive advantage.

  • Navigating the modern advertising ecosystem requires a sophisticated understanding of interconnected strategies. Key decisions revolve around measuring ROI in cookieless advertising and establishing best practices for generative AI creative. A critical evaluation is the retail media network vs programmatic debate, where brands weigh the benefits of closed-loop attribution against the scale of the open web.
  • For video, implementing effective CTV advertising frequency capping strategies is essential to avoid audience fatigue. Strategically, implementing data clean rooms for partnerships is becoming a cornerstone for privacy-compliant data collaboration. Operationally, mitigating ad fraud in mobile apps and enabling brand safety controls for user-generated content are constant priorities.
  • The core of modern strategy is building a first-party data strategy and optimizing campaigns with first-party data. This is supported by integrating CDP with a DSP and leveraging contextual targeting for privacy compliance. Using dynamic creative for personalized campaigns and effective attribution models for OOH are key tactics.
  • The technical challenges include enabling cross-device targeting without cookies, creating commercially safe generative AI, and understanding the impact of signal loss on measurement. Firms that master a holistic approach, from leveraging AI for predictive audience buying to comparing universal ID solutions, see a more than 50% improvement in campaign efficiency.
  • The focus extends to micro-optimizations like reducing ad load time for better UX and tactical decisions like audience verification in programmatic audio. Finally, developing strategies for walled garden advertising, using the privacy sandbox API for advertisers, and achieving full-funnel attribution for retail media are imperative for competitive advantage.

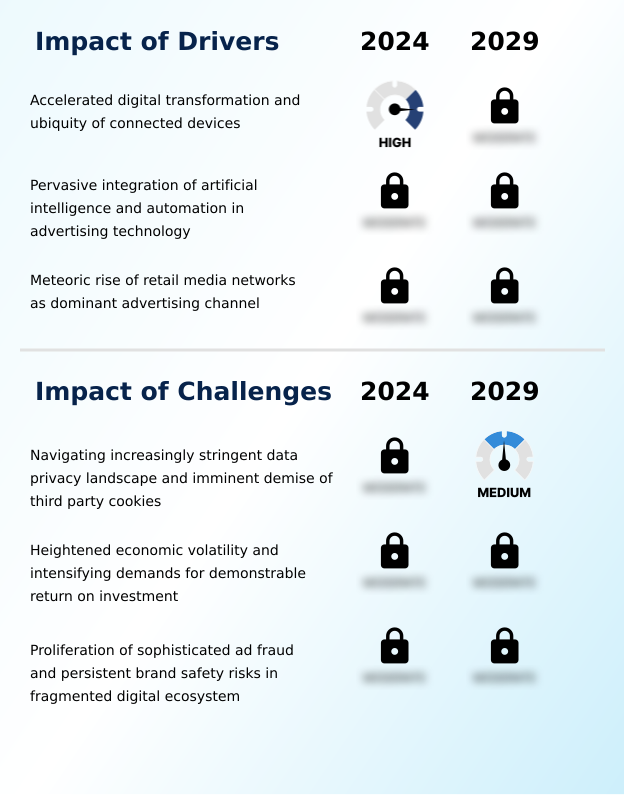
What are the key market drivers leading to the rise in the adoption of Advertising Services Industry?

  • The accelerated pace of digital transformation, combined with the ubiquity of connected devices, is a key driver propelling market growth.

  • Market growth is fueled by the strategic shift toward a first-party data strategy, enabled by the integration of a customer data platform (CDP).
  • This allows for more precise journey orchestration ads and predictive audience modeling, which improves the effectiveness of automated media buying.
  • The result is a more efficient media mix modeling process, where channels like addressable television advertising and augmented reality (AR) advertising can be measured more accurately.
  • For example, location-based marketing, powered by this data, can increase foot traffic by up to 20%. The rise of influencer marketing platforms and affiliate marketing networks further diversifies reach, creating phygital experiences that bridge online and offline worlds.
  • Advertisers are focused on optimizing cost per mille (CPM) through better targeting, with the ad server technology playing a crucial role in delivering these personalized messages.

What are the market trends shaping the Advertising Services Industry?

  • The pervasive integration of generative artificial intelligence is emerging as a significant market trend, reshaping creative processes, campaign optimization, and audience personalization across the industry.

  • Key trends are reshaping the advertising services market, led by the pervasive integration of generative AI and the proliferation of retail media networks. These networks, combined with the growth of connected TV (CTV) and ad-supported video-on-demand (AVOD), offer new avenues for audience segmentation.
  • Advertisers utilize a demand-side platform (DSP) for efficient ad inventory management and to deploy dynamic creative optimization at scale. For instance, campaigns using AI-powered copywriting can achieve a 15% higher engagement rate. The creative landscape is also evolving, with anamorphic 3D billboards used in out-of-home (OOH) advertising to create immersive brand experiences.
  • The fusion of content and commerce, or shoppertainment, is becoming mainstream, supported by native advertising formats that blend seamlessly with user experiences, driving both engagement and transactions.

What challenges does the Advertising Services Industry face during its growth?

  • Navigating an increasingly stringent data privacy landscape and the imminent demise of third-party cookies presents a key challenge affecting industry growth.

  • The market faces significant hurdles, primarily centered on third-party cookie deprecation and the need for robust brand safety protocols. This shift necessitates the adoption of cookieless identity solutions and privacy-enhancing technologies to maintain targeting capabilities. Navigating a walled garden ecosystem while ensuring ad verification remains a complex task.
  • The industry's response includes the use of data clean rooms for secure data collaboration and a renewed focus on user consent management. For instance, implementing advanced ad fraud detection tools can reduce wasted spend by over 30%. Measurement is also evolving, with attention metrics gaining prominence over simple viewability metrics to gauge true engagement.
  • Ensuring effective content-level targeting and server-side ad insertion without violating privacy is a key technical challenge, demanding sophisticated cross-channel measurement frameworks.

Exclusive Technavio Analysis on Customer Landscape

The advertising services market forecasting report includes the adoption lifecycle of the market, covering from the innovator’s stage to the laggard’s stage. It focuses on adoption rates in different regions based on penetration. Furthermore, the advertising services market report also includes key purchase criteria and drivers of price sensitivity to help companies evaluate and develop their market growth analysis strategies.

Customer Landscape of Advertising Services Industry

Competitive Landscape

Companies are implementing various strategies, such as strategic alliances, advertising services market forecast, partnerships, mergers and acquisitions, geographical expansion, and product/service launches, to enhance their presence in the industry.

Amazon.com Inc. - Provides solutions leveraging first-party shopper data, enabling brands to target consumers across e-commerce platforms and partner sites to enhance reach and sales impact.

The industry research and growth report includes detailed analyses of the competitive landscape of the market and information about key companies, including:

  • Amazon.com Inc.
  • Apple Inc.
  • Criteo SA
  • Dentsu Group Inc.
  • Droga5
  • Google Cloud
  • Magnite Inc.
  • Meta Platforms Inc.
  • Microsoft Corp.
  • Omnicom Group Inc.
  • Pinterest Inc.
  • Publicis Groupe SA
  • PubMatic Inc.
  • Reddit Inc.
  • Snap Inc.
  • The Interpublic Group of Companies Inc.
  • The Trade Desk Inc.
  • Wieden Kennedy
  • WPP Plc
  • X Corp.

Qualitative and quantitative analysis of companies has been conducted to help clients understand the wider business environment as well as the strengths and weaknesses of key industry players. Data is qualitatively analyzed to categorize companies as pure play, category-focused, industry-focused, and diversified; it is quantitatively analyzed to categorize companies as dominant, leading, strong, tentative, and weak.

Recent Development and News in Advertising services market

  • In October, 2024, Amazon.com Inc. announced a strategic partnership with Magnite Inc. to integrate its demand-side platform with Amazon's publisher services, expanding programmatic access to Amazon's ad inventory.
  • In January, 2025, Publicis Groupe SA launched a proprietary generative AI platform, 'CreativeCore AI,' designed to automate campaign creative generation and performance analysis, reporting a 20% increase in creative asset production during trials.
  • In March, 2025, The Trade Desk Inc. announced the full interoperability of its Unified ID 2.0 solution with several major European retail media networks, creating a standardized identity framework for advertising across the open internet.
  • In May, 2025, WPP Plc announced a global strategic alliance with Microsoft Corp. to co-develop AI-powered advertising solutions on Microsoft's Azure cloud platform, aiming to provide clients with advanced audience modeling and campaign optimization tools.

Dive into Technavio’s robust research methodology, blending expert interviews, extensive data synthesis, and validated models for unparalleled Advertising Services Market insights. See full methodology.

Market Scope
Page number 309
Base year 2024
Historic period 2019-2023
Forecast period 2025-2029
Growth momentum & CAGR Accelerate at a CAGR of 4.4%
Market growth 2025-2029 USD 166.4 billion
Market structure Fragmented
YoY growth 2024-2025(%) 4.3%
Key countries US, Canada, Mexico, China, India, Japan, South Korea, Australia, Indonesia, Germany, UK, France, Italy, The Netherlands, Spain, Brazil, Argentina, Colombia, Saudi Arabia, UAE, South Africa, Israel and Turkey
Competitive landscape Leading Companies, Market Positioning of Companies, Competitive Strategies, and Industry Risks

Request Free Sample

Research Analyst Overview

  • The advertising services market is fundamentally reshaped by the dual pressures of technological advancement and privacy-centric reforms. Boardroom decisions are now centered on the strategic implementation of a first-party data strategy, driven by the need to navigate third-party cookie deprecation.
  • The pervasive integration of generative AI and dynamic creative optimization is not merely a tactical shift but a strategic imperative, forcing a re-evaluation of creative budgets and talent. Organizations leveraging these technologies have managed to reduce campaign production timelines by over 40%.
  • The rise of retail media networks and connected TV (CTV) has fragmented the media landscape, demanding more sophisticated media mix modeling and attribution modeling. Consequently, technologies like the customer data platform (CDP), demand-side platform (DSP), and supply-side platform (SSP) are critical infrastructure.
  • Executing campaigns via programmatic advertising, including programmatic direct and real-time bidding (RTB) on ad exchange platforms, is now standard.
  • This complex environment, with its walled garden ecosystems, makes ad verification and ad fraud detection more critical than ever, with a constant focus on improving performance marketing metrics such as return on ad spend (ROAS) and click-through rate (CTR) while managing cost per mille (CPM).

What are the Key Data Covered in this Advertising Services Market Research and Growth Report?

  • What is the expected growth of the Advertising Services Market between 2025 and 2029?

    • USD 166.4 billion, at a CAGR of 4.4%

  • What segmentation does the market report cover?

    • The report is segmented by Type (Digital advertising, TV advertising, Print advertising, OOH advertising, and Others), Business Model (Online advertising, and Offline advertising), End-user (Consumer goods and retail, IT and telecom, Government and public sector, BFSI, and Others) and Geography (North America, APAC, Europe, South America, Middle East and Africa)

  • Which regions are analyzed in the report?

    • North America, APAC, Europe, South America and Middle East and Africa

  • What are the key growth drivers and market challenges?

    • Accelerated digital transformation and ubiquity of connected devices, Navigating increasingly stringent data privacy landscape and imminent demise of third party cookies

  • Who are the major players in the Advertising Services Market?

    • Amazon.com Inc., Apple Inc., Criteo SA, Dentsu Group Inc., Droga5, Google Cloud, Magnite Inc., Meta Platforms Inc., Microsoft Corp., Omnicom Group Inc., Pinterest Inc., Publicis Groupe SA, PubMatic Inc., Reddit Inc., Snap Inc., The Interpublic Group of Companies Inc., The Trade Desk Inc., Wieden Kennedy, WPP Plc and X Corp.

Market Research Insights

  • The market's momentum is driven by the tension between technological advancement and privacy imperatives. The adoption of immersive brand experiences and shoppable video ads is creating more engaging consumer touchpoints, with early adopters reporting a 15% lift in user interaction.
  • Concurrently, the need for robust privacy-enhancing technologies is non-negotiable, as platforms that implement transparent user consent management build greater consumer trust. Solutions offering closed-loop attribution are becoming standard, demonstrating up to a 30% clearer return on ad spend compared to traditional models.
  • AI-powered copywriting and other forms of automation are streamlining workflows, enabling marketing teams to focus on strategy rather than repetitive execution. This dynamic interplay shapes a landscape where cross-channel measurement and efficiency are paramount.

We can help! Our analysts can customize this advertising services market research report to meet your requirements.

Get in touch

1. Executive Summary

1.1 Market overview

Executive Summary - Chart on Market Overview
Executive Summary - Data Table on Market Overview
Executive Summary - Chart on Global Market Characteristics
Executive Summary - Chart on Market by Geography
Executive Summary - Chart on Market Segmentation by Type
Executive Summary - Chart on Market Segmentation by Business Model
Executive Summary - Chart on Market Segmentation by End-user
Executive Summary - Chart on Incremental Growth
Executive Summary - Data Table on Incremental Growth
Executive Summary - Chart on Company Market Positioning

2. Technavio Analysis

2.1 Analysis of price sensitivity, lifecycle, customer purchase basket, adoption rates, and purchase criteria

2.2 Criticality of inputs and Factors of differentiation

Chart on Overview on criticality of inputs and factors of differentiation

2.3 Factors of disruption

Chart on Overview on factors of disruption

2.4 Impact of drivers and challenges

Chart on Impact of drivers and challenges in 2024 and 2029

3. Market Landscape

3.1 Market ecosystem

Chart on Parent Market
Data Table on - Parent Market

3.2 Market characteristics

Chart on Market characteristics analysis

3.3 Value chain analysis

Chart on Value chain analysis

4. Market Sizing

4.1 Market definition

Data Table on Offerings of companies included in the market definition

4.2 Market segment analysis

Market segments

4.3 Market size 2024

4.4 Market outlook: Forecast for 2024-2029

Chart on Global - Market size and forecast 2024-2029 ($ billion)
Data Table on Global - Market size and forecast 2024-2029 ($ billion)
Chart on Global Market: Year-over-year growth 2024-2029 (%)
Data Table on Global Market: Year-over-year growth 2024-2029 (%)

5. Historic Market Size

5.1 Global Advertising Services Market 2019 - 2023

Historic Market Size - Data Table on Global Advertising Services Market 2019 - 2023 ($ billion)

5.2 Type segment analysis 2019 - 2023

Historic Market Size - Type Segment 2019 - 2023 ($ billion)

5.3 Business Model segment analysis 2019 - 2023

Historic Market Size - Business Model Segment 2019 - 2023 ($ billion)

5.4 End-user segment analysis 2019 - 2023

Historic Market Size - End-user Segment 2019 - 2023 ($ billion)

5.5 Geography segment analysis 2019 - 2023

Historic Market Size - Geography Segment 2019 - 2023 ($ billion)

5.6 Country segment analysis 2019 - 2023

Historic Market Size - Country Segment 2019 - 2023 ($ billion)

6. Qualitative Analysis

6.1 The AI impact on Global Advertising Services Market

7. Five Forces Analysis

7.1 Five forces summary

Five forces analysis - Comparison between 2024 and 2029

7.2 Bargaining power of buyers

Bargaining power of buyers - Impact of key factors 2024 and 2029

7.3 Bargaining power of suppliers

Bargaining power of suppliers - Impact of key factors in 2024 and 2029

7.4 Threat of new entrants

Threat of new entrants - Impact of key factors in 2024 and 2029

7.5 Threat of substitutes

Threat of substitutes - Impact of key factors in 2024 and 2029

7.6 Threat of rivalry

Threat of rivalry - Impact of key factors in 2024 and 2029

7.7 Market condition

Chart on Market condition - Five forces 2024 and 2029

8. Market Segmentation by Type

8.1 Market segments

Chart on Type - Market share 2024-2029 (%)
Data Table on Type - Market share 2024-2029 (%)

8.2 Comparison by Type

Chart on Comparison by Type
Data Table on Comparison by Type

8.3 Digital advertising - Market size and forecast 2024-2029

Chart on Digital advertising - Market size and forecast 2024-2029 ($ billion)
Data Table on Digital advertising - Market size and forecast 2024-2029 ($ billion)
Chart on Digital advertising - Year-over-year growth 2024-2029 (%)
Data Table on Digital advertising - Year-over-year growth 2024-2029 (%)

8.4 TV advertising - Market size and forecast 2024-2029

Chart on TV advertising - Market size and forecast 2024-2029 ($ billion)
Data Table on TV advertising - Market size and forecast 2024-2029 ($ billion)
Chart on TV advertising - Year-over-year growth 2024-2029 (%)
Data Table on TV advertising - Year-over-year growth 2024-2029 (%)

8.5 Print advertising - Market size and forecast 2024-2029

Chart on Print advertising - Market size and forecast 2024-2029 ($ billion)
Data Table on Print advertising - Market size and forecast 2024-2029 ($ billion)
Chart on Print advertising - Year-over-year growth 2024-2029 (%)
Data Table on Print advertising - Year-over-year growth 2024-2029 (%)

8.6 OOH advertising - Market size and forecast 2024-2029

Chart on OOH advertising - Market size and forecast 2024-2029 ($ billion)
Data Table on OOH advertising - Market size and forecast 2024-2029 ($ billion)
Chart on OOH advertising - Year-over-year growth 2024-2029 (%)
Data Table on OOH advertising - Year-over-year growth 2024-2029 (%)

8.7 Others - Market size and forecast 2024-2029

Chart on Others - Market size and forecast 2024-2029 ($ billion)
Data Table on Others - Market size and forecast 2024-2029 ($ billion)
Chart on Others - Year-over-year growth 2024-2029 (%)
Data Table on Others - Year-over-year growth 2024-2029 (%)

8.8 Market opportunity by Type

Market opportunity by Type ($ billion)
Data Table on Market opportunity by Type ($ billion)

9. Market Segmentation by Business Model

9.1 Market segments

Chart on Market Segmentation by Business Model - Market share 2024-2029 (%)
Data Table on Market Segmentation by Business Model - Market share 2024-2029 (%)

9.2 Comparison by Market Segmentation by Business Model

Chart on Comparison by Market Segmentation by Business Model
Data Table on Comparison by Market Segmentation by Business Model

9.3 Online advertising - Market size and forecast 2024-2029

Chart on Online advertising - Market size and forecast 2024-2029 ($ billion)
Data Table on Online advertising - Market size and forecast 2024-2029 ($ billion)
Chart on Online advertising - Year-over-year growth 2024-2029 (%)
Data Table on Online advertising - Year-over-year growth 2024-2029 (%)

9.4 Offline advertising - Market size and forecast 2024-2029

Chart on Offline advertising - Market size and forecast 2024-2029 ($ billion)
Data Table on Offline advertising - Market size and forecast 2024-2029 ($ billion)
Chart on Offline advertising - Year-over-year growth 2024-2029 (%)
Data Table on Offline advertising - Year-over-year growth 2024-2029 (%)

9.5 Market opportunity by Market Segmentation by Business Model

Market opportunity by Market Segmentation by Business Model ($ billion)
Data Table on Market opportunity by Market Segmentation by Business Model ($ billion)

10. Market Segmentation by End-user

10.1 Market segments

Chart on End-user - Market share 2024-2029 (%)
Data Table on End-user - Market share 2024-2029 (%)

10.2 Comparison by End-user

Chart on Comparison by End-user
Data Table on Comparison by End-user

10.3 Consumer goods and retail - Market size and forecast 2024-2029

Chart on Consumer goods and retail - Market size and forecast 2024-2029 ($ billion)
Data Table on Consumer goods and retail - Market size and forecast 2024-2029 ($ billion)
Chart on Consumer goods and retail - Year-over-year growth 2024-2029 (%)
Data Table on Consumer goods and retail - Year-over-year growth 2024-2029 (%)

10.4 IT and telecom - Market size and forecast 2024-2029

Chart on IT and telecom - Market size and forecast 2024-2029 ($ billion)
Data Table on IT and telecom - Market size and forecast 2024-2029 ($ billion)
Chart on IT and telecom - Year-over-year growth 2024-2029 (%)
Data Table on IT and telecom - Year-over-year growth 2024-2029 (%)

10.5 Government and public sector - Market size and forecast 2024-2029

Chart on Government and public sector - Market size and forecast 2024-2029 ($ billion)
Data Table on Government and public sector - Market size and forecast 2024-2029 ($ billion)
Chart on Government and public sector - Year-over-year growth 2024-2029 (%)
Data Table on Government and public sector - Year-over-year growth 2024-2029 (%)

10.6 BFSI - Market size and forecast 2024-2029

Chart on BFSI - Market size and forecast 2024-2029 ($ billion)
Data Table on BFSI - Market size and forecast 2024-2029 ($ billion)
Chart on BFSI - Year-over-year growth 2024-2029 (%)
Data Table on BFSI - Year-over-year growth 2024-2029 (%)

10.7 Others - Market size and forecast 2024-2029

Chart on Others - Market size and forecast 2024-2029 ($ billion)
Data Table on Others - Market size and forecast 2024-2029 ($ billion)
Chart on Others - Year-over-year growth 2024-2029 (%)
Data Table on Others - Year-over-year growth 2024-2029 (%)

10.8 Market opportunity by End-user

Market opportunity by End-user ($ billion)
Data Table on Market opportunity by End-user ($ billion)

11. Customer Landscape

11.1 Customer landscape overview

Analysis of price sensitivity, lifecycle, customer purchase basket, adoption rates, and purchase criteria

12. Geographic Landscape

12.1 Geographic segmentation

Chart on Market share by geography 2024-2029 (%)
Data Table on Market share by geography 2024-2029 (%)

12.2 Geographic comparison

Chart on Geographic comparison
Data Table on Geographic comparison

12.3 North America - Market size and forecast 2024-2029

Chart on North America - Market size and forecast 2024-2029 ($ billion)
Data Table on North America - Market size and forecast 2024-2029 ($ billion)
Chart on North America - Year-over-year growth 2024-2029 (%)
Data Table on North America - Year-over-year growth 2024-2029 (%)
Chart on Regional Comparison - North America
Data Table on Regional Comparison - North America

12.3.1 US - Market size and forecast 2024-2029

Chart on US - Market size and forecast 2024-2029 ($ billion)
Data Table on US - Market size and forecast 2024-2029 ($ billion)
Chart on US - Year-over-year growth 2024-2029 (%)
Data Table on US - Year-over-year growth 2024-2029 (%)

12.3.2 Canada - Market size and forecast 2024-2029

Chart on Canada - Market size and forecast 2024-2029 ($ billion)
Data Table on Canada - Market size and forecast 2024-2029 ($ billion)
Chart on Canada - Year-over-year growth 2024-2029 (%)
Data Table on Canada - Year-over-year growth 2024-2029 (%)

12.3.3 Mexico - Market size and forecast 2024-2029

Chart on Mexico - Market size and forecast 2024-2029 ($ billion)
Data Table on Mexico - Market size and forecast 2024-2029 ($ billion)
Chart on Mexico - Year-over-year growth 2024-2029 (%)
Data Table on Mexico - Year-over-year growth 2024-2029 (%)

12.4 APAC - Market size and forecast 2024-2029

Chart on APAC - Market size and forecast 2024-2029 ($ billion)
Data Table on APAC - Market size and forecast 2024-2029 ($ billion)
Chart on APAC - Year-over-year growth 2024-2029 (%)
Data Table on APAC - Year-over-year growth 2024-2029 (%)
Chart on Regional Comparison - APAC
Data Table on Regional Comparison - APAC

12.4.1 China - Market size and forecast 2024-2029

Chart on China - Market size and forecast 2024-2029 ($ billion)
Data Table on China - Market size and forecast 2024-2029 ($ billion)
Chart on China - Year-over-year growth 2024-2029 (%)
Data Table on China - Year-over-year growth 2024-2029 (%)

12.4.2 India - Market size and forecast 2024-2029

Chart on India - Market size and forecast 2024-2029 ($ billion)
Data Table on India - Market size and forecast 2024-2029 ($ billion)
Chart on India - Year-over-year growth 2024-2029 (%)
Data Table on India - Year-over-year growth 2024-2029 (%)

12.4.3 Japan - Market size and forecast 2024-2029

Chart on Japan - Market size and forecast 2024-2029 ($ billion)
Data Table on Japan - Market size and forecast 2024-2029 ($ billion)
Chart on Japan - Year-over-year growth 2024-2029 (%)
Data Table on Japan - Year-over-year growth 2024-2029 (%)

12.4.4 South Korea - Market size and forecast 2024-2029

Chart on South Korea - Market size and forecast 2024-2029 ($ billion)
Data Table on South Korea - Market size and forecast 2024-2029 ($ billion)
Chart on South Korea - Year-over-year growth 2024-2029 (%)
Data Table on South Korea - Year-over-year growth 2024-2029 (%)

12.4.5 Australia - Market size and forecast 2024-2029

Chart on Australia - Market size and forecast 2024-2029 ($ billion)
Data Table on Australia - Market size and forecast 2024-2029 ($ billion)
Chart on Australia - Year-over-year growth 2024-2029 (%)
Data Table on Australia - Year-over-year growth 2024-2029 (%)

12.4.6 Indonesia - Market size and forecast 2024-2029

Chart on Indonesia - Market size and forecast 2024-2029 ($ billion)
Data Table on Indonesia - Market size and forecast 2024-2029 ($ billion)
Chart on Indonesia - Year-over-year growth 2024-2029 (%)
Data Table on Indonesia - Year-over-year growth 2024-2029 (%)

12.5 Europe - Market size and forecast 2024-2029

Chart on Europe - Market size and forecast 2024-2029 ($ billion)
Data Table on Europe - Market size and forecast 2024-2029 ($ billion)
Chart on Europe - Year-over-year growth 2024-2029 (%)
Data Table on Europe - Year-over-year growth 2024-2029 (%)
Chart on Regional Comparison - Europe
Data Table on Regional Comparison - Europe

12.5.1 Germany - Market size and forecast 2024-2029

Chart on Germany - Market size and forecast 2024-2029 ($ billion)
Data Table on Germany - Market size and forecast 2024-2029 ($ billion)
Chart on Germany - Year-over-year growth 2024-2029 (%)
Data Table on Germany - Year-over-year growth 2024-2029 (%)

12.5.2 UK - Market size and forecast 2024-2029

Chart on UK - Market size and forecast 2024-2029 ($ billion)
Data Table on UK - Market size and forecast 2024-2029 ($ billion)
Chart on UK - Year-over-year growth 2024-2029 (%)
Data Table on UK - Year-over-year growth 2024-2029 (%)

12.5.3 France - Market size and forecast 2024-2029

Chart on France - Market size and forecast 2024-2029 ($ billion)
Data Table on France - Market size and forecast 2024-2029 ($ billion)
Chart on France - Year-over-year growth 2024-2029 (%)
Data Table on France - Year-over-year growth 2024-2029 (%)

12.5.4 Italy - Market size and forecast 2024-2029

Chart on Italy - Market size and forecast 2024-2029 ($ billion)
Data Table on Italy - Market size and forecast 2024-2029 ($ billion)
Chart on Italy - Year-over-year growth 2024-2029 (%)
Data Table on Italy - Year-over-year growth 2024-2029 (%)

12.5.5 The Netherlands - Market size and forecast 2024-2029

Chart on The Netherlands - Market size and forecast 2024-2029 ($ billion)
Data Table on The Netherlands - Market size and forecast 2024-2029 ($ billion)
Chart on The Netherlands - Year-over-year growth 2024-2029 (%)
Data Table on The Netherlands - Year-over-year growth 2024-2029 (%)

12.5.6 Spain - Market size and forecast 2024-2029

Chart on Spain - Market size and forecast 2024-2029 ($ billion)
Data Table on Spain - Market size and forecast 2024-2029 ($ billion)
Chart on Spain - Year-over-year growth 2024-2029 (%)
Data Table on Spain - Year-over-year growth 2024-2029 (%)

12.6 South America - Market size and forecast 2024-2029

Chart on South America - Market size and forecast 2024-2029 ($ billion)
Data Table on South America - Market size and forecast 2024-2029 ($ billion)
Chart on South America - Year-over-year growth 2024-2029 (%)
Data Table on South America - Year-over-year growth 2024-2029 (%)
Chart on Regional Comparison - South America
Data Table on Regional Comparison - South America

12.6.1 Brazil - Market size and forecast 2024-2029

Chart on Brazil - Market size and forecast 2024-2029 ($ billion)
Data Table on Brazil - Market size and forecast 2024-2029 ($ billion)
Chart on Brazil - Year-over-year growth 2024-2029 (%)
Data Table on Brazil - Year-over-year growth 2024-2029 (%)

12.6.2 Argentina - Market size and forecast 2024-2029

Chart on Argentina - Market size and forecast 2024-2029 ($ billion)
Data Table on Argentina - Market size and forecast 2024-2029 ($ billion)
Chart on Argentina - Year-over-year growth 2024-2029 (%)
Data Table on Argentina - Year-over-year growth 2024-2029 (%)

12.6.3 Colombia - Market size and forecast 2024-2029

Chart on Colombia - Market size and forecast 2024-2029 ($ billion)
Data Table on Colombia - Market size and forecast 2024-2029 ($ billion)
Chart on Colombia - Year-over-year growth 2024-2029 (%)
Data Table on Colombia - Year-over-year growth 2024-2029 (%)

12.7 Middle East and Africa - Market size and forecast 2024-2029

Chart on Middle East and Africa - Market size and forecast 2024-2029 ($ billion)
Data Table on Middle East and Africa - Market size and forecast 2024-2029 ($ billion)
Chart on Middle East and Africa - Year-over-year growth 2024-2029 (%)
Data Table on Middle East and Africa - Year-over-year growth 2024-2029 (%)
Chart on Regional Comparison - Middle East and Africa
Data Table on Regional Comparison - Middle East and Africa

12.7.1 Saudi Arabia - Market size and forecast 2024-2029

Chart on Saudi Arabia - Market size and forecast 2024-2029 ($ billion)
Data Table on Saudi Arabia - Market size and forecast 2024-2029 ($ billion)
Chart on Saudi Arabia - Year-over-year growth 2024-2029 (%)
Data Table on Saudi Arabia - Year-over-year growth 2024-2029 (%)

12.7.2 UAE - Market size and forecast 2024-2029

Chart on UAE - Market size and forecast 2024-2029 ($ billion)
Data Table on UAE - Market size and forecast 2024-2029 ($ billion)
Chart on UAE - Year-over-year growth 2024-2029 (%)
Data Table on UAE - Year-over-year growth 2024-2029 (%)

12.7.3 South Africa - Market size and forecast 2024-2029

Chart on South Africa - Market size and forecast 2024-2029 ($ billion)
Data Table on South Africa - Market size and forecast 2024-2029 ($ billion)
Chart on South Africa - Year-over-year growth 2024-2029 (%)
Data Table on South Africa - Year-over-year growth 2024-2029 (%)

12.7.4 Israel - Market size and forecast 2024-2029

Chart on Israel - Market size and forecast 2024-2029 ($ billion)
Data Table on Israel - Market size and forecast 2024-2029 ($ billion)
Chart on Israel - Year-over-year growth 2024-2029 (%)
Data Table on Israel - Year-over-year growth 2024-2029 (%)

12.7.5 Turkey - Market size and forecast 2024-2029

Chart on Turkey - Market size and forecast 2024-2029 ($ billion)
Data Table on Turkey - Market size and forecast 2024-2029 ($ billion)
Chart on Turkey - Year-over-year growth 2024-2029 (%)
Data Table on Turkey - Year-over-year growth 2024-2029 (%)

12.8 Market opportunity by geography

Market opportunity by geography ($ billion)
Data Tables on Market opportunity by geography ($ billion)

13. Drivers, Challenges, and Opportunity

13.1 Market drivers

Accelerated digital transformation and ubiquity of connected devices
Pervasive integration of artificial intelligence and automation in advertising technology
Meteoric rise of retail media networks as dominant advertising channel

13.2 Market challenges

Navigating increasingly stringent data privacy landscape and imminent demise of third party cookies
Heightened economic volatility and intensifying demands for demonstrable return on investment
Proliferation of sophisticated ad fraud and persistent brand safety risks in fragmented digital ecosystem

13.3 Impact of drivers and challenges

Impact of drivers and challenges in 2024 and 2029

13.4 Market opportunities

Pervasive integration of generative artificial intelligence
Proliferation of retail media networks and rise of commerce media
Navigating privacy-centric, post-cookie advertising ecosystem

14. Competitive Landscape

14.1 Overview

14.2

Overview on criticality of inputs and factors of differentiation

14.3 Landscape disruption

Overview on factors of disruption

14.4 Industry risks

Impact of key risks on business

15. Competitive Analysis

15.1 Companies profiled

Companies covered

15.2 Company ranking index

15.3 Market positioning of companies

Matrix on companies position and classification

15.4 Amazon.com Inc.

Amazon.com Inc. - Overview
Amazon.com Inc. - Business segments
Amazon.com Inc. - Key news
Amazon.com Inc. - Key offerings
Amazon.com Inc. - Segment focus
SWOT

15.5 Apple Inc.

Apple Inc. - Overview
Apple Inc. - Business segments
Apple Inc. - Key news
Apple Inc. - Key offerings
Apple Inc. - Segment focus
SWOT

15.6 Criteo SA

Criteo SA - Overview
Criteo SA - Product / Service
Criteo SA - Key offerings
SWOT

15.7 Dentsu Group Inc.

Dentsu Group Inc. - Overview
Dentsu Group Inc. - Business segments
Dentsu Group Inc. - Key offerings
Dentsu Group Inc. - Segment focus
SWOT

15.8 Google Cloud

Google Cloud - Overview
Google Cloud - Product / Service
Google Cloud - Key offerings
SWOT

15.9 Meta Platforms Inc.

Meta Platforms Inc. - Overview
Meta Platforms Inc. - Business segments
Meta Platforms Inc. - Key offerings
Meta Platforms Inc. - Segment focus
SWOT

15.10 Microsoft Corp.

Microsoft Corp. - Overview
Microsoft Corp. - Business segments
Microsoft Corp. - Key news
Microsoft Corp. - Key offerings
Microsoft Corp. - Segment focus
SWOT

15.11 Omnicom Group Inc.

Omnicom Group Inc. - Overview
Omnicom Group Inc. - Business segments
Omnicom Group Inc. - Key offerings
Omnicom Group Inc. - Segment focus
SWOT

15.12 Pinterest Inc.

Pinterest Inc. - Overview
Pinterest Inc. - Product / Service
Pinterest Inc. - Key news
Pinterest Inc. - Key offerings
SWOT

15.13 Publicis Groupe SA

Publicis Groupe SA - Overview
Publicis Groupe SA - Product / Service
Publicis Groupe SA - Key offerings
SWOT

15.14 Snap Inc.

Snap Inc. - Overview
Snap Inc. - Product / Service
Snap Inc. - Key offerings
SWOT

15.15 The Interpublic Group of Companies Inc.

The Interpublic Group of Companies Inc. - Overview
The Interpublic Group of Companies Inc. - Business segments
The Interpublic Group of Companies Inc. - Key offerings
The Interpublic Group of Companies Inc. - Segment focus
SWOT

15.16 The Trade Desk Inc.

The Trade Desk Inc. - Overview
The Trade Desk Inc. - Product / Service
The Trade Desk Inc. - Key offerings
SWOT

15.17 WPP Plc

WPP Plc - Overview
WPP Plc - Product / Service
WPP Plc - Key offerings
SWOT

15.18 X Corp.

X Corp. - Overview
X Corp. - Product / Service
X Corp. - Key offerings
SWOT

16. Appendix

16.1 Scope of the report

Market definition
Objectives
Notes and caveats

16.2 Inclusions and exclusions checklist

Inclusions checklist
Exclusions checklist

16.3 Currency conversion rates for US$

16.4 Research methodology

16.5 Data procurement

Information sources

16.6 Data validation

16.7 Validation techniques employed for market sizing

16.8 Data synthesis

16.9 360 degree market analysis

16.10 List of abbreviations

Research Methodology

Technavio presents a detailed picture of the market by way of study, synthesis, and summation of data from multiple sources. The analysts have presented the various facets of the market with a particular focus on identifying the key industry influencers. The data thus presented is comprehensive, reliable, and the result of extensive research, both primary and secondary.

INFORMATION SOURCES

Primary sources

  • Manufacturers and suppliers
  • Channel partners
  • Industry experts
  • Strategic decision makers

Secondary sources

  • Industry journals and periodicals
  • Government data
  • Financial reports of key industry players
  • Historical data
  • Press releases

DATA ANALYSIS

Data Synthesis

  • Collation of data
  • Estimation of key figures
  • Analysis of derived insights

Data Validation

  • Triangulation with data models
  • Reference against proprietary databases
  • Corroboration with industry experts

REPORT WRITING

Qualitative

  • Market drivers
  • Market challenges
  • Market trends
  • Five forces analysis

Quantitative

  • Market size and forecast
  • Market segmentation
  • Geographical insights
  • Competitive landscape

Interested in this report?

Get your sample now to see our research methodology and insights!

Download Now

Frequently Asked Questions

Advertising Services market growth will increase by USD 166.4 billion during 2025-2029.

The Advertising Services market is expected to grow at a CAGR of 4.4% during 2025-2029.

Advertising Services market is segmented by Type (Digital advertising, TV advertising, Print advertising, OOH advertising, Others) Business model (Online advertising, Offline advertising) End-user (Consumer goods and retail, IT and telecom, Government and public sector, BFSI, Others)

Amazon.com Inc., Apple Inc., Criteo SA, Dentsu Group Inc., Droga5, Google Cloud, Magnite Inc., Meta Platforms Inc., Microsoft Corp., Omnicom Group Inc., Pinterest Inc., Publicis Groupe SA, PubMatic Inc., Reddit Inc., Snap Inc., The Interpublic Group of Companies Inc., The Trade Desk Inc., Wieden Kennedy, WPP Plc, X Corp. are a few of the key vendors in the Advertising Services market.

North America will register the highest growth rate of 38.4% among the other regions. Therefore, the Advertising Services market in North America is expected to garner significant business opportunities for the vendors during the forecast period.

US, Canada, Mexico, China, India, Japan, South Korea, Australia, Indonesia, Germany, UK, France, Italy, The Netherlands, Spain, Brazil, Argentina, Colombia, Saudi Arabia, UAE, South Africa, Israel, Turkey

  • Accelerated digital transformation and ubiquity of connected devices is the driving factor this market.

The Advertising Services market vendors should focus on grabbing business opportunities from the Type segment as it accounted for the largest market share in the base year.