4K2K TV Market Analysis, Size, and Forecast 2026-2030: APAC (China, India, and Japan), North America (US, Canada, and Mexico), Europe (Germany, UK, and France), South America (Brazil and Argentina), Middle East and Africa (Saudi Arabia, UAE, and South Africa), and Rest of World (ROW)

4K2K TV Market Analysis, Size, and Forecast 2026-2030:
APAC (China, India, and Japan), North America (US, Canada, and Mexico), Europe (Germany, UK, and France), South America (Brazil and Argentina), Middle East and Africa (Saudi Arabia, UAE, and South Africa), and Rest of World (ROW)

Published: Mar 2026 300 Pages SKU: IRTNTR70652

Market Overview at a Glance

$19.23 B
Market Opportunity
6%
CAGR 2025 - 2030
49.8%
APAC Growth
$21.85 B
60 to 69 inches segment 2024

4K2K TV Market Size 2026-2030

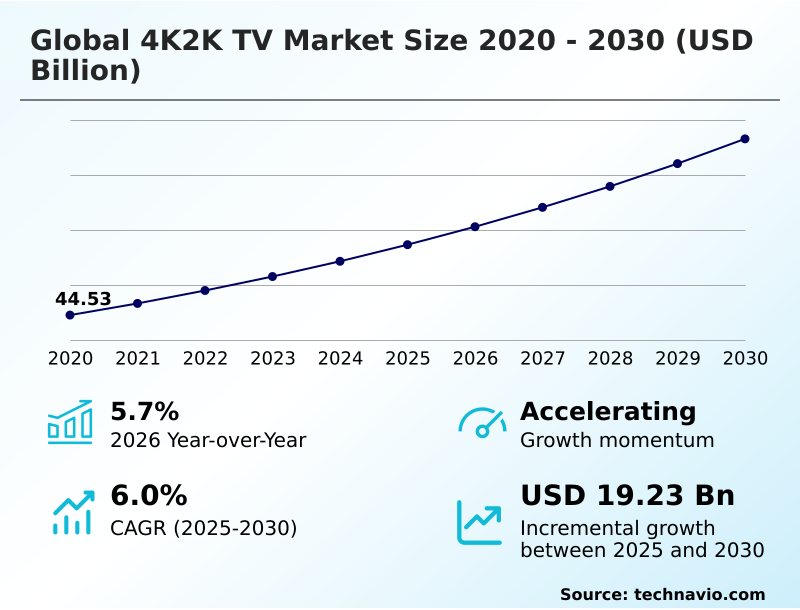
The 4k2k tv market size is valued to increase by USD 19.23 billion, at a CAGR of 6% from 2025 to 2030. Structural expansion of gaming sector and demand for high-refresh displays will drive the 4k2k tv market.

Major Market Trends & Insights

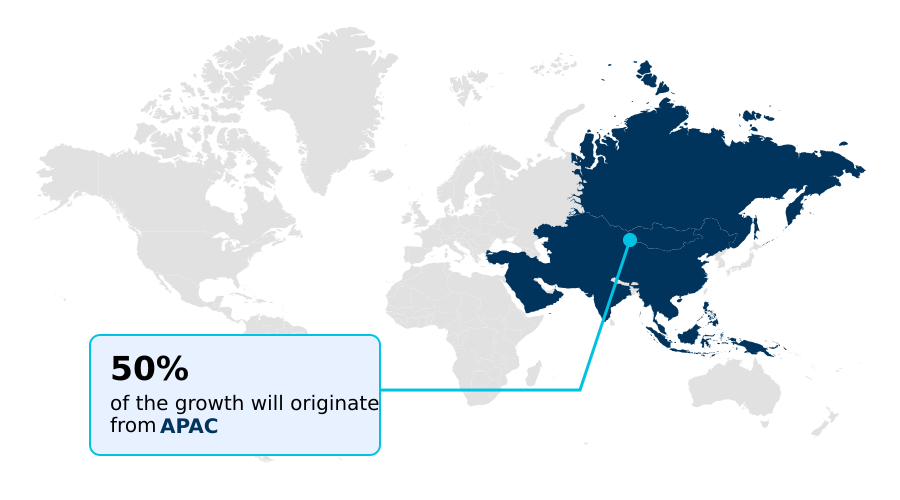
  • APAC dominated the market and accounted for a 49.8% growth during the forecast period.
  • By Display Size - 60 to 69 inches segment was valued at USD 21.85 billion in 2024
  • By Distribution Channel - Offline segment accounted for the largest market revenue share in 2024

Market Size & Forecast

  • Market Opportunities: USD 32.04 billion
  • Market Future Opportunities: USD 19.23 billion
  • CAGR from 2025 to 2030 : 6%

Market Summary

  • The 4K2K TV market is undergoing a significant transformation, moving beyond resolution benchmarks to focus on intelligent performance and ecosystem integration. This evolution is driven by the demand for superior visual fidelity, fueled by the expansion of high-bandwidth streaming services and the technical requirements of modern gaming consoles.
  • Key advancements include the mainstreaming of AI-enhanced upscaling, where neural processing units use deep-learning algorithms to refine lower-resolution content in real-time. For instance, a manufacturer can leverage these on-device machine learning capabilities to ensure a consistent ultra-high-definition experience, regardless of the source, effectively extending the value of the hardware and addressing content availability gaps.
  • This pivot towards software-defined value is critical. Simultaneously, the industry is navigating challenges related to rapid hardware obsolescence cycles and the high capital expenditure for next-generation panel technologies like RGB tandem OLED and micro RGB displays.
  • The market's trajectory is increasingly defined by how effectively brands can balance cutting-edge innovation, such as high nit output and variable refresh rate, with consumer-facing challenges like energy efficiency standards and content parity, ensuring sustained relevance in a competitive landscape focused on delivering an interactive immersion experience.

What will be the Size of the 4K2K TV Market during the forecast period?

Get Key Insights on Market Forecast (PDF) Request Free Sample

How is the 4K2K TV Market Segmented?

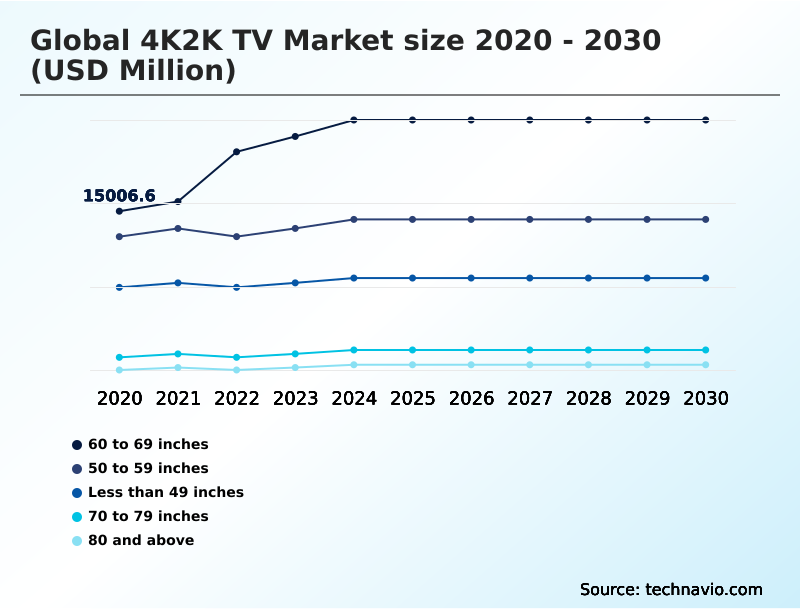
The 4k2k tv industry research report provides comprehensive data (region-wise segment analysis), with forecasts and estimates in "USD million" for the period 2026-2030, as well as historical data from 2020-2024 for the following segments.

  • Display size
    • 60 to 69 inches
    • 50 to 59 inches
    • Less than 49 inches
    • 70 to 79 inches
    • 80 and above
  • Distribution channel
    • Offline
    • Online
  • Application
    • Household
    • Commercial
  • Geography
    • APAC
      • China
      • India
      • Japan
    • North America
      • US
      • Canada
      • Mexico
    • Europe
      • Germany
      • UK
      • France
    • South America
      • Brazil
      • Argentina
    • Middle East and Africa
      • Saudi Arabia
      • UAE
      • South Africa
    • Rest of World (ROW)

By Display Size Insights

The 60 to 69 inches segment is estimated to witness significant growth during the forecast period.

The 60 to 69 inches segment is a high-growth tier, favored by consumers seeking a cinematic experience in standard living spaces.

This category benefits from improved manufacturing yields, which have facilitated more aggressive pricing, with the price gap between premium panel types narrowing to within 10% in some cases.

The integration of advanced AI-enhanced upscaling and intelligent content processing ensures that legacy high-definition content is rendered with near-native 4K clarity.

As streaming platforms expand their ultra-high-definition libraries, these models, featuring technologies like variable refresh rate and auto low latency mode, are becoming the default choice for households upgrading from smaller units.

This balance of size, performance with object-based sharpening, and affordability, supported by on-device machine learning, ensures the segment captures a substantial portion of the replacement market in developed regions, driven by the need for high-fidelity gaming applications.

Request Free Sample

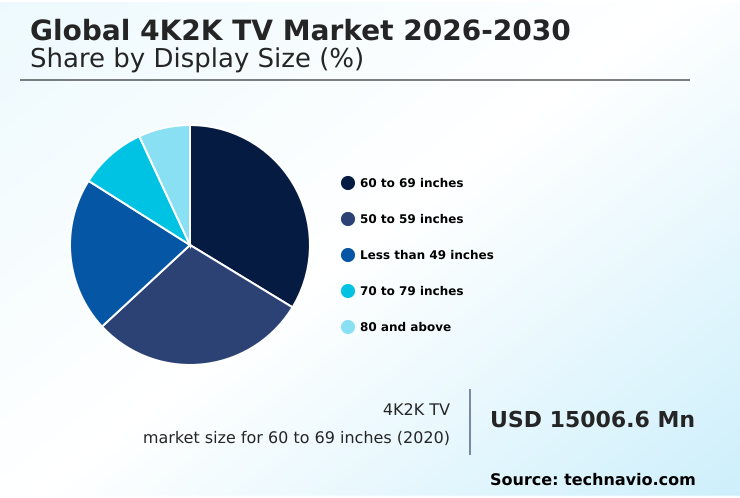
The 60 to 69 inches segment was valued at USD 21.85 billion in 2024 and showed a gradual increase during the forecast period.

Request Free Sample

Regional Analysis

APAC is estimated to contribute 49.8% to the growth of the global market during the forecast period.Technavio’s analysts have elaborately explained the regional trends and drivers that shape the market during the forecast period.

See How 4K2K TV Market Demand is Rising in APAC Request Free Sample

The geographic landscape is characterized by a dual-growth narrative, with mature markets focusing on premiumization and emerging regions driving volume. North America, with a market expansion rate of 6.6%, emphasizes ultra-thin aesthetics and advanced smart features like conversational interaction.

In contrast, APAC, which is set to contribute nearly 49.8% of the market's incremental growth, prioritizes accessible 4K technology and local manufacturing incentives.

Europe remains a key region, though its growth of 5.6% is tempered by stringent regulations such as power consumption mandates. This regulatory environment pushes for innovation in technologies like blue phosphorescent oled.

The success in these varied regions depends on tailoring product strategies, from deploying wallpaper form factors and high nit output displays in developed economies to managing semiconductor component volatility and fabrications line depreciation in high-growth areas, all while addressing state-level sustainability requirements.

Market Dynamics

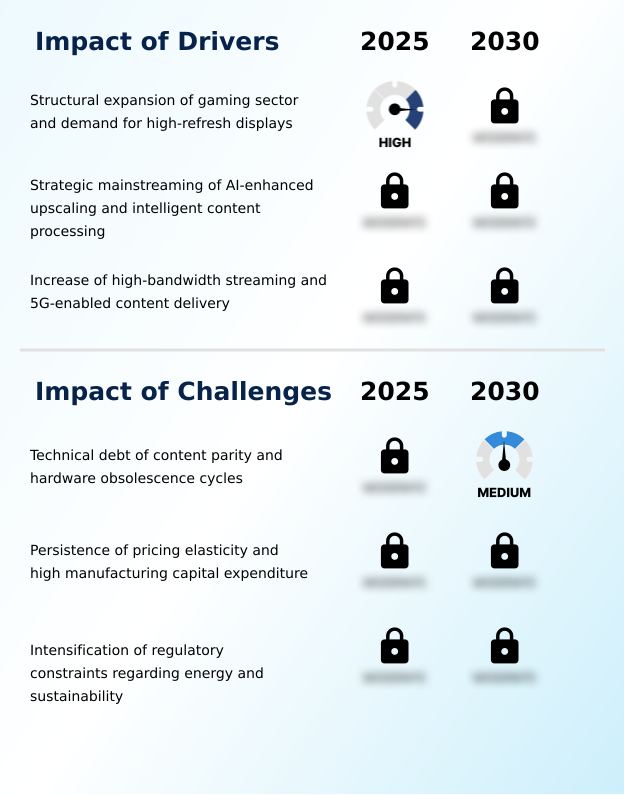
Our researchers analyzed the data with 2025 as the base year, along with the key drivers, trends, and challenges. A holistic analysis of drivers will help companies refine their marketing strategies to gain a competitive advantage.

  • The market's evolution is defined by a complex interplay of hardware capabilities and software intelligence, directly influencing strategic decision-making. Key performance indicators like ai picture upscaling performance are becoming more critical than raw pixel counts, as they address the persistent challenge of 4k content availability vs hardware.
  • The mini-led vs oled brightness comparison continues to drive innovation, with both technologies vying for dominance in premium home cinema setups. For interactive entertainment, features such as high refresh rate console gaming, esports monitor input lag reduction, and broad support for hdmi 2.1 gaming features are now standard requirements.
  • The rise of minimalist interior design has accelerated demand for wireless connectivity minimalist tv setups, further advanced by innovations like the zero connect box for tvs.
  • On the content delivery side, the adoption of the av1 codec for 4k streaming is essential for efficiency; its implementation can reduce bandwidth needs by over 25% compared to older standards, a crucial operational advantage for service providers. This efficiency is vital as the industry navigates 8k content adoption challenges and the associated hardware costs.
  • Meanwhile, the tandem oled panel lifespan benefits and the capabilities of the nq4 gen3 processor features are extending product viability. The high cost of large-format oled panel costs remains a barrier, but ongoing smart tv os platform integration and the sophistication of the ai content recommendation engine are creating new value streams.
  • Beyond entertainment, specialized applications such as medical imaging 4k display accuracy highlight the technology's expanding utility, even as ultra-short-throw projector alternatives present a growing competitive threat.

What are the key market drivers leading to the rise in the adoption of 4K2K TV Industry?

  • The market's growth is primarily driven by the structural expansion of the gaming sector, which fuels demand for high-refresh displays.

  • Market growth is significantly propelled by the convergence of high-performance gaming and advanced content delivery.
  • The demand for console gaming displays with 120Hz native refresh rates and HDMI 2.1 connectivity has become a primary driver, with such features now standard on mid-to-high-tier models.
  • This has led to a more than 50% increase in the adoption of large-format TVs for gaming setups over the last two years.
  • Concurrently, the expansion of cloud gaming platforms and the availability of data-intensive 4K content are pushing the need for robust connectivity solutions like Wi-Fi 7 modules and low-latency ethernet ports.
  • This synergy between interactive media and content infrastructure, supported by technologies like 144hz refresh rates and intelligent picture calibration, ensures sustained demand for sophisticated 4K2K hardware.

What are the market trends shaping the 4K2K TV Industry?

  • The market is increasingly shaped by the inclusion of generative artificial intelligence. This is coupled with the integration of cognitive vision processing to enhance user experiences.

  • Key market trends are centered on the integration of advanced display architectures and intelligent processing. The proliferation of RGB mini-LED and dual-layer tandem designs is enabling unprecedented peak brightness and contrast, with some high-end models achieving a high nit output that improves performance in well-lit environments by over 40%. This addresses a critical consumer demand for versatile, high-performance displays.
  • The adoption of vision AI platforms with contextual content surfacing capabilities is transforming passive screens into interactive hubs. This trend toward interactive immersion is further enhanced by the use of external connect boxes and zero-gap wall mounts, which support minimalist aesthetics.
  • These developments, including innovations like VVC video codec support and advanced local dimming zones, signify a move toward a more holistic and user-centric entertainment experience.

What challenges does the 4K2K TV Industry face during its growth?

  • A key challenge affecting industry growth is the technical debt arising from a lack of content parity, which is exacerbated by rapid hardware obsolescence cycles.

  • The market faces considerable challenges from rapid technological churn and evolving regulatory landscapes. Hardware obsolescence cycles are accelerating, placing pressure on manufacturers to innovate while managing consumer expectations for longevity. The introduction of features like 180hz native refresh rates can render premium models outdated quickly.
  • Simultaneously, new energy efficiency standards are forcing design revisions, with some regulations mandating up to a 20% reduction in standby power consumption. This requires investment in more efficient components and power management systems.
  • These pressures, combined with high-volume sales cycles in a commoditizing market and the need to offer a compelling personalized viewing experience, create a complex operational environment for all industry participants.

Exclusive Technavio Analysis on Customer Landscape

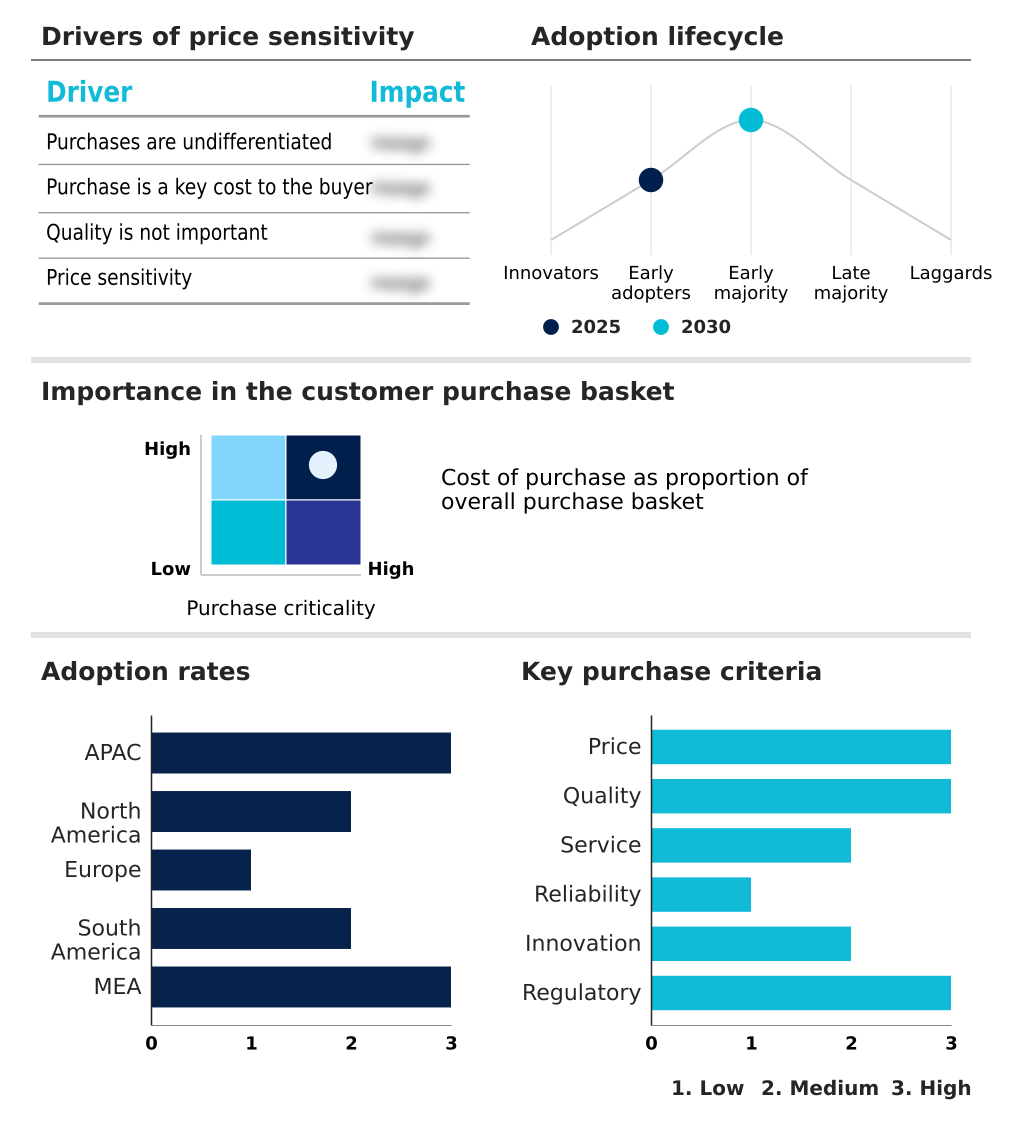
The 4k2k tv market forecasting report includes the adoption lifecycle of the market, covering from the innovator’s stage to the laggard’s stage. It focuses on adoption rates in different regions based on penetration. Furthermore, the 4k2k tv market report also includes key purchase criteria and drivers of price sensitivity to help companies evaluate and develop their market growth analysis strategies.

Customer Landscape of 4K2K TV Industry

Competitive Landscape

Companies are implementing various strategies, such as strategic alliances, 4k2k tv market forecast, partnerships, mergers and acquisitions, geographical expansion, and product/service launches, to enhance their presence in the industry.

Element Electronics Holdings LLC - Offers accessible consumer technology, including smart televisions and monitors, with a strategic focus on domestic assembly operations.

The industry research and growth report includes detailed analyses of the competitive landscape of the market and information about key companies, including:

  • Element Electronics Holdings LLC
  • Funai Electric Co. Ltd.
  • Grundig Intermedia GmbH
  • Haier Smart Home Co. Ltd.
  • Hisense International Co. Ltd.
  • Koninklijke Philips NV
  • LG Electronics Inc.
  • OnePlus Technology Co. Ltd.
  • Panasonic Holdings Corp.
  • Realme Chongqing Mobile Corp.
  • Samsung Electronics Co. Ltd.
  • Sharp Corp.
  • Skyworth Group Ltd.
  • Sony Group Corp.
  • TCL Industries Holdings Ltd.
  • Toshiba Corp.
  • TPV Technology Co. Ltd.
  • VIZIO Holding Corp.
  • Vu Technologies Pvt. Ltd.
  • Xiaomi Corp.

Qualitative and quantitative analysis of companies has been conducted to help clients understand the wider business environment as well as the strengths and weaknesses of key industry players. Data is qualitatively analyzed to categorize companies as pure play, category-focused, industry-focused, and diversified; it is quantitatively analyzed to categorize companies as dominant, leading, strong, tentative, and weak.

Recent Development and News in 4k2k tv market

  • In January 2025, Samsung Electronics Co. Ltd. unveiled its flagship 130-inch Micro RGB television, debuting the Vision AI Companion platform designed to transform the television into an interactive smart home hub.
  • In February 2025, The European Commission's updated energy efficiency regulation, (EU) 2023/826, took full effect, enforcing stricter power consumption limits for all electronic household equipment, including high-resolution 4K2K TVs.
  • In March 2025, LG Electronics Inc. launched its latest OLED evo series, incorporating the Alpha 11 AI Processor Gen3 and hyper radiant color technology to deliver substantially higher luminance levels and improved color volume.
  • In April 2025, Skyworth Group Ltd. completed the acquisition of Panasonic Holdings Corp.'s television business operations in Europe and the United States, significantly expanding its regional market footprint and brand portfolio.

Dive into Technavio’s robust research methodology, blending expert interviews, extensive data synthesis, and validated models for unparalleled 4K2K TV Market insights. See full methodology.

Market Scope
Page number 300
Base year 2025
Historic period 2020-2024
Forecast period 2026-2030
Growth momentum & CAGR Accelerate at a CAGR of 6%
Market growth 2026-2030 USD 19234.6 million
Market structure Fragmented
YoY growth 2025-2026(%) 5.7%
Key countries China, India, Japan, South Korea, Indonesia, Australia, US, Canada, Mexico, Germany, UK, France, Italy, Spain, The Netherlands, Brazil, Argentina, Chile, Saudi Arabia, UAE, South Africa, Turkey and Israel
Competitive landscape Leading Companies, Market Positioning of Companies, Competitive Strategies, and Industry Risks

Request Free Sample

Research Analyst Overview

  • The 4K2K TV market has pivoted from a hardware-centric model to one defined by software-driven intelligence and ecosystem integration. The strategic focus is now on advanced processing and user experience, where the deployment of neural processing units for generative artificial intelligence and cognitive vision processing has become a key differentiator.
  • This shift is a direct response to the boardroom-level decision to invest in ai-enhanced upscaling to bridge the content gap rather than solely competing on panel technology.
  • The integration of high-bandwidth streaming services, now comprising over 66% of content delivery revenue on major platforms, has solidified the demand for devices capable of handling sophisticated video codecs and delivering high dynamic range imaging. Innovations in panel architecture, such as rgb tandem oled, mini-led backlighting, and quantum dot enhancement, are crucial for delivering the visual fidelity consumers expect.
  • Features like variable refresh rate and auto low latency mode, once niche, are now standard expectations, driven by the gaming sector. The market's future hinges on balancing these technological advancements, including vision ai platforms and oled evo technology, with the practicalities of 5g-enabled content delivery and consumer demand.

What are the Key Data Covered in this 4K2K TV Market Research and Growth Report?

  • What is the expected growth of the 4K2K TV Market between 2026 and 2030?

    • USD 19.23 billion, at a CAGR of 6%

  • What segmentation does the market report cover?

    • The report is segmented by Display Size (60 to 69 inches, 50 to 59 inches, Less than 49 inches, 70 to 79 inches, and 80 and above), Distribution Channel (Offline, and Online), Application (Household, and Commercial) and Geography (APAC, North America, Europe, South America, Middle East and Africa)

  • Which regions are analyzed in the report?

    • APAC, North America, Europe, South America and Middle East and Africa

  • What are the key growth drivers and market challenges?

    • Structural expansion of gaming sector and demand for high-refresh displays, Technical debt of content parity and hardware obsolescence cycles

  • Who are the major players in the 4K2K TV Market?

    • Element Electronics Holdings LLC, Funai Electric Co. Ltd., Grundig Intermedia GmbH, Haier Smart Home Co. Ltd., Hisense International Co. Ltd., Koninklijke Philips NV, LG Electronics Inc., OnePlus Technology Co. Ltd., Panasonic Holdings Corp., Realme Chongqing Mobile Corp., Samsung Electronics Co. Ltd., Sharp Corp., Skyworth Group Ltd., Sony Group Corp., TCL Industries Holdings Ltd., Toshiba Corp., TPV Technology Co. Ltd., VIZIO Holding Corp., Vu Technologies Pvt. Ltd. and Xiaomi Corp.

Market Research Insights

  • Market dynamics are increasingly shaped by the institutionalization of advanced display technologies and intelligent software. The adoption of high-performance panels is accelerating, with the price differential between leading technologies narrowing to within 10% for popular screen sizes, fostering democratized premiumization. This shift enables broader access to features previously reserved for flagship models.
  • Concurrently, the content ecosystem has matured, with 4K streaming now accounting for over 66% of revenue for major platforms, mandating hardware that supports data-intensive 4K content and HDR content delivery. This creates a strong pull for devices with sophisticated vision AI companions and support for competitive esports monitors.
  • Manufacturers are responding by embedding features that facilitate a personalized viewing experience and buffer-free playback, ensuring products align with the high expectations of a digitally native consumer base.

We can help! Our analysts can customize this 4k2k tv market research report to meet your requirements.

Get in touch

1. Executive Summary

1.1 Market overview

Executive Summary - Chart on Market Overview
Executive Summary - Data Table on Market Overview
Executive Summary - Chart on Global Market Characteristics
Executive Summary - Chart on Market by Geography
Executive Summary - Chart on Market Segmentation by Display Size
Executive Summary - Chart on Market Segmentation by Distribution Channel
Executive Summary - Chart on Market Segmentation by Application
Executive Summary - Chart on Incremental Growth
Executive Summary - Data Table on Incremental Growth
Executive Summary - Chart on Company Market Positioning

2. Technavio Analysis

2.1 Analysis of price sensitivity, lifecycle, customer purchase basket, adoption rates, and purchase criteria

2.2 Criticality of inputs and Factors of differentiation

Chart on Overview on criticality of inputs and factors of differentiation

2.3 Factors of disruption

Chart on Overview on factors of disruption

2.4 Impact of drivers and challenges

Chart on Impact of drivers and challenges in 2025 and 2030

3. Market Landscape

3.1 Market ecosystem

Chart on Parent Market
Data Table on - Parent Market

3.2 Market characteristics

Chart on Market characteristics analysis

3.3 Value chain analysis

Chart on Value chain analysis

4. Market Sizing

4.1 Market definition

Data Table on Offerings of companies included in the market definition

4.2 Market segment analysis

Market segments

4.3 Market size 2025

4.4 Market outlook: Forecast for 2025-2030

Chart on Global - Market size and forecast 2025-2030 ($ million)
Data Table on Global - Market size and forecast 2025-2030 ($ million)
Chart on Global Market: Year-over-year growth 2025-2030 (%)
Data Table on Global Market: Year-over-year growth 2025-2030 (%)

5. Historic Market Size

5.1 Global 4K2K TV Market 2020 - 2024

Historic Market Size - Data Table on Global 4K2K TV Market 2020 - 2024 ($ million)

5.2 Display Size segment analysis 2020 - 2024

Historic Market Size - Display Size Segment 2020 - 2024 ($ million)

5.3 Distribution Channel segment analysis 2020 - 2024

Historic Market Size - Distribution Channel Segment 2020 - 2024 ($ million)

5.4 Application segment analysis 2020 - 2024

Historic Market Size - Application Segment 2020 - 2024 ($ million)

5.5 Geography segment analysis 2020 - 2024

Historic Market Size - Geography Segment 2020 - 2024 ($ million)

5.6 Country segment analysis 2020 - 2024

Historic Market Size - Country Segment 2020 - 2024 ($ million)

6. Qualitative Analysis

6.1 Impact of AI in global 4K2K TV market

6.2 Impact of geopolitical conflict for global 4K2K TV market

7. Five Forces Analysis

7.1 Five forces summary

Five forces analysis - Comparison between 2025 and 2030

7.2 Bargaining power of buyers

Bargaining power of buyers - Impact of key factors 2025 and 2030

7.3 Bargaining power of suppliers

Bargaining power of suppliers - Impact of key factors in 2025 and 2030

7.4 Threat of new entrants

Threat of new entrants - Impact of key factors in 2025 and 2030

7.5 Threat of substitutes

Threat of substitutes - Impact of key factors in 2025 and 2030

7.6 Threat of rivalry

Threat of rivalry - Impact of key factors in 2025 and 2030

7.7 Market condition

Chart on Market condition - Five forces 2025 and 2030

8. Market Segmentation by Display Size

8.1 Market segments

Chart on Display Size - Market share 2025-2030 (%)
Data Table on Display Size - Market share 2025-2030 (%)

8.2 Comparison by Display Size

Chart on Comparison by Display Size
Data Table on Comparison by Display Size

8.3 60 to 69 inches - Market size and forecast 2025-2030

Chart on 60 to 69 inches - Market size and forecast 2025-2030 ($ million)
Data Table on 60 to 69 inches - Market size and forecast 2025-2030 ($ million)
Chart on 60 to 69 inches - Year-over-year growth 2025-2030 (%)
Data Table on 60 to 69 inches - Year-over-year growth 2025-2030 (%)

8.4 50 to 59 inches - Market size and forecast 2025-2030

Chart on 50 to 59 inches - Market size and forecast 2025-2030 ($ million)
Data Table on 50 to 59 inches - Market size and forecast 2025-2030 ($ million)
Chart on 50 to 59 inches - Year-over-year growth 2025-2030 (%)
Data Table on 50 to 59 inches - Year-over-year growth 2025-2030 (%)

8.5 Less than 49 inches - Market size and forecast 2025-2030

Chart on Less than 49 inches - Market size and forecast 2025-2030 ($ million)
Data Table on Less than 49 inches - Market size and forecast 2025-2030 ($ million)
Chart on Less than 49 inches - Year-over-year growth 2025-2030 (%)
Data Table on Less than 49 inches - Year-over-year growth 2025-2030 (%)

8.6 70 to 79 inches - Market size and forecast 2025-2030

Chart on 70 to 79 inches - Market size and forecast 2025-2030 ($ million)
Data Table on 70 to 79 inches - Market size and forecast 2025-2030 ($ million)
Chart on 70 to 79 inches - Year-over-year growth 2025-2030 (%)
Data Table on 70 to 79 inches - Year-over-year growth 2025-2030 (%)

8.7 80 and above - Market size and forecast 2025-2030

Chart on 80 and above - Market size and forecast 2025-2030 ($ million)
Data Table on 80 and above - Market size and forecast 2025-2030 ($ million)
Chart on 80 and above - Year-over-year growth 2025-2030 (%)
Data Table on 80 and above - Year-over-year growth 2025-2030 (%)

8.8 Market opportunity by Display Size

Market opportunity by Display Size ($ million)
Data Table on Market opportunity by Display Size ($ million)

9. Market Segmentation by Distribution Channel

9.1 Market segments

Chart on Distribution Channel - Market share 2025-2030 (%)
Data Table on Distribution Channel - Market share 2025-2030 (%)

9.2 Comparison by Distribution Channel

Chart on Comparison by Distribution Channel
Data Table on Comparison by Distribution Channel

9.3 Offline - Market size and forecast 2025-2030

Chart on Offline - Market size and forecast 2025-2030 ($ million)
Data Table on Offline - Market size and forecast 2025-2030 ($ million)
Chart on Offline - Year-over-year growth 2025-2030 (%)
Data Table on Offline - Year-over-year growth 2025-2030 (%)

9.4 Online - Market size and forecast 2025-2030

Chart on Online - Market size and forecast 2025-2030 ($ million)
Data Table on Online - Market size and forecast 2025-2030 ($ million)
Chart on Online - Year-over-year growth 2025-2030 (%)
Data Table on Online - Year-over-year growth 2025-2030 (%)

9.5 Market opportunity by Distribution Channel

Market opportunity by Distribution Channel ($ million)
Data Table on Market opportunity by Distribution Channel ($ million)

10. Market Segmentation by Application

10.1 Market segments

Chart on Application - Market share 2025-2030 (%)
Data Table on Application - Market share 2025-2030 (%)

10.2 Comparison by Application

Chart on Comparison by Application
Data Table on Comparison by Application

10.3 Household - Market size and forecast 2025-2030

Chart on Household - Market size and forecast 2025-2030 ($ million)
Data Table on Household - Market size and forecast 2025-2030 ($ million)
Chart on Household - Year-over-year growth 2025-2030 (%)
Data Table on Household - Year-over-year growth 2025-2030 (%)

10.4 Commercial - Market size and forecast 2025-2030

Chart on Commercial - Market size and forecast 2025-2030 ($ million)
Data Table on Commercial - Market size and forecast 2025-2030 ($ million)
Chart on Commercial - Year-over-year growth 2025-2030 (%)
Data Table on Commercial - Year-over-year growth 2025-2030 (%)

10.5 Market opportunity by Application

Market opportunity by Application ($ million)
Data Table on Market opportunity by Application ($ million)

11. Customer Landscape

11.1 Customer landscape overview

Analysis of price sensitivity, lifecycle, customer purchase basket, adoption rates, and purchase criteria

12. Geographic Landscape

12.1 Geographic segmentation

Chart on Market share by geography 2025-2030 (%)
Data Table on Market share by geography 2025-2030 (%)

12.2 Geographic comparison

Chart on Geographic comparison
Data Table on Geographic comparison

12.3 APAC - Market size and forecast 2025-2030

Chart on APAC - Market size and forecast 2025-2030 ($ million)
Data Table on APAC - Market size and forecast 2025-2030 ($ million)
Chart on APAC - Year-over-year growth 2025-2030 (%)
Data Table on APAC - Year-over-year growth 2025-2030 (%)
Chart on Regional Comparison - APAC
Data Table on Regional Comparison - APAC

12.3.1 China - Market size and forecast 2025-2030

Chart on China - Market size and forecast 2025-2030 ($ million)
Data Table on China - Market size and forecast 2025-2030 ($ million)
Chart on China - Year-over-year growth 2025-2030 (%)
Data Table on China - Year-over-year growth 2025-2030 (%)

12.3.2 India - Market size and forecast 2025-2030

Chart on India - Market size and forecast 2025-2030 ($ million)
Data Table on India - Market size and forecast 2025-2030 ($ million)
Chart on India - Year-over-year growth 2025-2030 (%)
Data Table on India - Year-over-year growth 2025-2030 (%)

12.3.3 Japan - Market size and forecast 2025-2030

Chart on Japan - Market size and forecast 2025-2030 ($ million)
Data Table on Japan - Market size and forecast 2025-2030 ($ million)
Chart on Japan - Year-over-year growth 2025-2030 (%)
Data Table on Japan - Year-over-year growth 2025-2030 (%)

12.3.4 South Korea - Market size and forecast 2025-2030

Chart on South Korea - Market size and forecast 2025-2030 ($ million)
Data Table on South Korea - Market size and forecast 2025-2030 ($ million)
Chart on South Korea - Year-over-year growth 2025-2030 (%)
Data Table on South Korea - Year-over-year growth 2025-2030 (%)

12.3.5 Indonesia - Market size and forecast 2025-2030

Chart on Indonesia - Market size and forecast 2025-2030 ($ million)
Data Table on Indonesia - Market size and forecast 2025-2030 ($ million)
Chart on Indonesia - Year-over-year growth 2025-2030 (%)
Data Table on Indonesia - Year-over-year growth 2025-2030 (%)

12.3.6 Australia - Market size and forecast 2025-2030

Chart on Australia - Market size and forecast 2025-2030 ($ million)
Data Table on Australia - Market size and forecast 2025-2030 ($ million)
Chart on Australia - Year-over-year growth 2025-2030 (%)
Data Table on Australia - Year-over-year growth 2025-2030 (%)

12.4 North America - Market size and forecast 2025-2030

Chart on North America - Market size and forecast 2025-2030 ($ million)
Data Table on North America - Market size and forecast 2025-2030 ($ million)
Chart on North America - Year-over-year growth 2025-2030 (%)
Data Table on North America - Year-over-year growth 2025-2030 (%)
Chart on Regional Comparison - North America
Data Table on Regional Comparison - North America

12.4.1 US - Market size and forecast 2025-2030

Chart on US - Market size and forecast 2025-2030 ($ million)
Data Table on US - Market size and forecast 2025-2030 ($ million)
Chart on US - Year-over-year growth 2025-2030 (%)
Data Table on US - Year-over-year growth 2025-2030 (%)

12.4.2 Canada - Market size and forecast 2025-2030

Chart on Canada - Market size and forecast 2025-2030 ($ million)
Data Table on Canada - Market size and forecast 2025-2030 ($ million)
Chart on Canada - Year-over-year growth 2025-2030 (%)
Data Table on Canada - Year-over-year growth 2025-2030 (%)

12.4.3 Mexico - Market size and forecast 2025-2030

Chart on Mexico - Market size and forecast 2025-2030 ($ million)
Data Table on Mexico - Market size and forecast 2025-2030 ($ million)
Chart on Mexico - Year-over-year growth 2025-2030 (%)
Data Table on Mexico - Year-over-year growth 2025-2030 (%)

12.5 Europe - Market size and forecast 2025-2030

Chart on Europe - Market size and forecast 2025-2030 ($ million)
Data Table on Europe - Market size and forecast 2025-2030 ($ million)
Chart on Europe - Year-over-year growth 2025-2030 (%)
Data Table on Europe - Year-over-year growth 2025-2030 (%)
Chart on Regional Comparison - Europe
Data Table on Regional Comparison - Europe

12.5.1 Germany - Market size and forecast 2025-2030

Chart on Germany - Market size and forecast 2025-2030 ($ million)
Data Table on Germany - Market size and forecast 2025-2030 ($ million)
Chart on Germany - Year-over-year growth 2025-2030 (%)
Data Table on Germany - Year-over-year growth 2025-2030 (%)

12.5.2 UK - Market size and forecast 2025-2030

Chart on UK - Market size and forecast 2025-2030 ($ million)
Data Table on UK - Market size and forecast 2025-2030 ($ million)
Chart on UK - Year-over-year growth 2025-2030 (%)
Data Table on UK - Year-over-year growth 2025-2030 (%)

12.5.3 France - Market size and forecast 2025-2030

Chart on France - Market size and forecast 2025-2030 ($ million)
Data Table on France - Market size and forecast 2025-2030 ($ million)
Chart on France - Year-over-year growth 2025-2030 (%)
Data Table on France - Year-over-year growth 2025-2030 (%)

12.5.4 Italy - Market size and forecast 2025-2030

Chart on Italy - Market size and forecast 2025-2030 ($ million)
Data Table on Italy - Market size and forecast 2025-2030 ($ million)
Chart on Italy - Year-over-year growth 2025-2030 (%)
Data Table on Italy - Year-over-year growth 2025-2030 (%)

12.5.5 Spain - Market size and forecast 2025-2030

Chart on Spain - Market size and forecast 2025-2030 ($ million)
Data Table on Spain - Market size and forecast 2025-2030 ($ million)
Chart on Spain - Year-over-year growth 2025-2030 (%)
Data Table on Spain - Year-over-year growth 2025-2030 (%)

12.5.6 The Netherlands - Market size and forecast 2025-2030

Chart on The Netherlands - Market size and forecast 2025-2030 ($ million)
Data Table on The Netherlands - Market size and forecast 2025-2030 ($ million)
Chart on The Netherlands - Year-over-year growth 2025-2030 (%)
Data Table on The Netherlands - Year-over-year growth 2025-2030 (%)

12.6 South America - Market size and forecast 2025-2030

Chart on South America - Market size and forecast 2025-2030 ($ million)
Data Table on South America - Market size and forecast 2025-2030 ($ million)
Chart on South America - Year-over-year growth 2025-2030 (%)
Data Table on South America - Year-over-year growth 2025-2030 (%)
Chart on Regional Comparison - South America
Data Table on Regional Comparison - South America

12.6.1 Brazil - Market size and forecast 2025-2030

Chart on Brazil - Market size and forecast 2025-2030 ($ million)
Data Table on Brazil - Market size and forecast 2025-2030 ($ million)
Chart on Brazil - Year-over-year growth 2025-2030 (%)
Data Table on Brazil - Year-over-year growth 2025-2030 (%)

12.6.2 Argentina - Market size and forecast 2025-2030

Chart on Argentina - Market size and forecast 2025-2030 ($ million)
Data Table on Argentina - Market size and forecast 2025-2030 ($ million)
Chart on Argentina - Year-over-year growth 2025-2030 (%)
Data Table on Argentina - Year-over-year growth 2025-2030 (%)

12.6.3 Chile - Market size and forecast 2025-2030

Chart on Chile - Market size and forecast 2025-2030 ($ million)
Data Table on Chile - Market size and forecast 2025-2030 ($ million)
Chart on Chile - Year-over-year growth 2025-2030 (%)
Data Table on Chile - Year-over-year growth 2025-2030 (%)

12.7 Middle East and Africa - Market size and forecast 2025-2030

Chart on Middle East and Africa - Market size and forecast 2025-2030 ($ million)
Data Table on Middle East and Africa - Market size and forecast 2025-2030 ($ million)
Chart on Middle East and Africa - Year-over-year growth 2025-2030 (%)
Data Table on Middle East and Africa - Year-over-year growth 2025-2030 (%)
Chart on Regional Comparison - Middle East and Africa
Data Table on Regional Comparison - Middle East and Africa

12.7.1 Saudi Arabia - Market size and forecast 2025-2030

Chart on Saudi Arabia - Market size and forecast 2025-2030 ($ million)
Data Table on Saudi Arabia - Market size and forecast 2025-2030 ($ million)
Chart on Saudi Arabia - Year-over-year growth 2025-2030 (%)
Data Table on Saudi Arabia - Year-over-year growth 2025-2030 (%)

12.7.2 UAE - Market size and forecast 2025-2030

Chart on UAE - Market size and forecast 2025-2030 ($ million)
Data Table on UAE - Market size and forecast 2025-2030 ($ million)
Chart on UAE - Year-over-year growth 2025-2030 (%)
Data Table on UAE - Year-over-year growth 2025-2030 (%)

12.7.3 South Africa - Market size and forecast 2025-2030

Chart on South Africa - Market size and forecast 2025-2030 ($ million)
Data Table on South Africa - Market size and forecast 2025-2030 ($ million)
Chart on South Africa - Year-over-year growth 2025-2030 (%)
Data Table on South Africa - Year-over-year growth 2025-2030 (%)

12.7.4 Turkey - Market size and forecast 2025-2030

Chart on Turkey - Market size and forecast 2025-2030 ($ million)
Data Table on Turkey - Market size and forecast 2025-2030 ($ million)
Chart on Turkey - Year-over-year growth 2025-2030 (%)
Data Table on Turkey - Year-over-year growth 2025-2030 (%)

12.7.5 Israel - Market size and forecast 2025-2030

Chart on Israel - Market size and forecast 2025-2030 ($ million)
Data Table on Israel - Market size and forecast 2025-2030 ($ million)
Chart on Israel - Year-over-year growth 2025-2030 (%)
Data Table on Israel - Year-over-year growth 2025-2030 (%)

12.8 Market opportunity by geography

Market opportunity by geography ($ million)
Data Tables on Market opportunity by geography ($ million)

13. Drivers, Challenges, and Opportunity

13.1 Market drivers

Structural expansion of gaming sector and demand for high-refresh displays
Strategic mainstreaming of AI-enhanced upscaling and intelligent content processing
Increase of high-bandwidth streaming and 5G-enabled content delivery

13.2 Market challenges

Technical debt of content parity and hardware obsolescence cycles
Persistence of pricing elasticity and high manufacturing capital expenditure
Intensification of regulatory constraints regarding energy and sustainability

13.3 Impact of drivers and challenges

Impact of drivers and challenges in 2025 and 2030

13.4 Market opportunities

Inclusion of generative artificial intelligence and cognitive vision processing
Growth of RGB tandem OLED and mini-LED backlighting architectures
Expansion of ultra-thin aesthetics and wireless connectivity ecosystems

14. Competitive Landscape

14.1 Overview

14.2

Overview on criticality of inputs and factors of differentiation

14.3 Landscape disruption

Overview on factors of disruption

14.4 Industry risks

Impact of key risks on business

15. Competitive Analysis

15.1 Companies profiled

Companies covered

15.2 Company ranking index

15.3 Market positioning of companies

Matrix on companies position and classification

15.4 Haier Smart Home Co. Ltd.

Haier Smart Home Co. Ltd. - Overview
Haier Smart Home Co. Ltd. - Business segments
Haier Smart Home Co. Ltd. - Key offerings
Haier Smart Home Co. Ltd. - Segment focus
SWOT

15.5 Hisense International Co. Ltd.

Hisense International Co. Ltd. - Overview
Hisense International Co. Ltd. - Product / Service
Hisense International Co. Ltd. - Key offerings
SWOT

15.6 Koninklijke Philips NV

Koninklijke Philips NV - Overview
Koninklijke Philips NV - Business segments
Koninklijke Philips NV - Key news
Koninklijke Philips NV - Key offerings
Koninklijke Philips NV - Segment focus
SWOT

15.7 LG Electronics Inc.

LG Electronics Inc. - Overview
LG Electronics Inc. - Business segments
LG Electronics Inc. - Key offerings
LG Electronics Inc. - Segment focus
SWOT

15.8 OnePlus Technology Co. Ltd.

OnePlus Technology Co. Ltd. - Overview
OnePlus Technology Co. Ltd. - Product / Service
OnePlus Technology Co. Ltd. - Key offerings
SWOT

15.9 Panasonic Holdings Corp.

Panasonic Holdings Corp. - Overview
Panasonic Holdings Corp. - Business segments
Panasonic Holdings Corp. - Key news
Panasonic Holdings Corp. - Key offerings
Panasonic Holdings Corp. - Segment focus
SWOT

15.10 Samsung Electronics Co. Ltd.

Samsung Electronics Co. Ltd. - Overview
Samsung Electronics Co. Ltd. - Business segments
Samsung Electronics Co. Ltd. - Key news
Samsung Electronics Co. Ltd. - Key offerings
Samsung Electronics Co. Ltd. - Segment focus
SWOT

15.11 Sharp Corp.

Sharp Corp. - Overview
Sharp Corp. - Business segments
Sharp Corp. - Key offerings
Sharp Corp. - Segment focus
SWOT

15.12 Skyworth Group Ltd.

Skyworth Group Ltd. - Overview
Skyworth Group Ltd. - Business segments
Skyworth Group Ltd. - Key offerings
Skyworth Group Ltd. - Segment focus
SWOT

15.13 Sony Group Corp.

Sony Group Corp. - Overview
Sony Group Corp. - Business segments
Sony Group Corp. - Key news
Sony Group Corp. - Key offerings
Sony Group Corp. - Segment focus
SWOT

15.14 TCL Industries Holdings Ltd.

TCL Industries Holdings Ltd. - Overview
TCL Industries Holdings Ltd. - Business segments
TCL Industries Holdings Ltd. - Key news
TCL Industries Holdings Ltd. - Key offerings
TCL Industries Holdings Ltd. - Segment focus
SWOT

15.15 Toshiba Corp.

Toshiba Corp. - Overview
Toshiba Corp. - Product / Service
Toshiba Corp. - Key offerings
SWOT

15.16 VIZIO Holding Corp.

VIZIO Holding Corp. - Overview
VIZIO Holding Corp. - Business segments
VIZIO Holding Corp. - Key offerings
VIZIO Holding Corp. - Segment focus
SWOT

15.17 Vu Technologies Pvt. Ltd.

Vu Technologies Pvt. Ltd. - Overview
Vu Technologies Pvt. Ltd. - Product / Service
Vu Technologies Pvt. Ltd. - Key offerings
SWOT

15.18 Xiaomi Corp.

Xiaomi Corp. - Overview
Xiaomi Corp. - Business segments
Xiaomi Corp. - Key offerings
Xiaomi Corp. - Segment focus
SWOT

16. Appendix

16.1 Scope of the report

Market definition
Objectives
Notes and caveats

16.2 Inclusions and exclusions checklist

Inclusions checklist
Exclusions checklist

16.3 Currency conversion rates for US$

16.4 Research methodology

16.5 Data procurement

Information sources

16.6 Data validation

16.7 Validation techniques employed for market sizing

16.8 Data synthesis

16.9 360 degree market analysis

16.10 List of abbreviations

Research Methodology

Technavio presents a detailed picture of the market by way of study, synthesis, and summation of data from multiple sources. The analysts have presented the various facets of the market with a particular focus on identifying the key industry influencers. The data thus presented is comprehensive, reliable, and the result of extensive research, both primary and secondary.

INFORMATION SOURCES

Primary sources

  • Manufacturers and suppliers
  • Channel partners
  • Industry experts
  • Strategic decision makers

Secondary sources

  • Industry journals and periodicals
  • Government data
  • Financial reports of key industry players
  • Historical data
  • Press releases

DATA ANALYSIS

Data Synthesis

  • Collation of data
  • Estimation of key figures
  • Analysis of derived insights

Data Validation

  • Triangulation with data models
  • Reference against proprietary databases
  • Corroboration with industry experts

REPORT WRITING

Qualitative

  • Market drivers
  • Market challenges
  • Market trends
  • Five forces analysis

Quantitative

  • Market size and forecast
  • Market segmentation
  • Geographical insights
  • Competitive landscape

Interested in this report?

Get your sample now to see our research methodology and insights!

Download Now

Frequently Asked Questions

4K2K TV market growth will increase by USD 19234.6 million during 2026-2030.

The 4K2K TV market is expected to grow at a CAGR of 6% during 2026-2030.

4K2K TV market is segmented by Display size (60 to 69 inches, 50 to 59 inches, Less than 49 inches, 70 to 79 inches, 80 and above) Distribution channel (Offline, Online) Application (Household, Commercial)

Element Electronics Holdings LLC, Funai Electric Co. Ltd., Grundig Intermedia GmbH, Haier Smart Home Co. Ltd., Hisense International Co. Ltd., Koninklijke Philips NV, LG Electronics Inc., OnePlus Technology Co. Ltd., Panasonic Holdings Corp., Realme Chongqing Mobile Corp., Samsung Electronics Co. Ltd., Sharp Corp., Skyworth Group Ltd., Sony Group Corp., TCL Industries Holdings Ltd., Toshiba Corp., TPV Technology Co. Ltd., VIZIO Holding Corp., Vu Technologies Pvt. Ltd., Xiaomi Corp. are a few of the key vendors in the 4K2K TV market.

APAC will register the highest growth rate of 49.8% among the other regions. Therefore, the 4K2K TV market in APAC is expected to garner significant business opportunities for the vendors during the forecast period.

China, India, Japan, South Korea, Indonesia, Australia, US, Canada, Mexico, Germany, UK, France, Italy, Spain, The Netherlands, Brazil, Argentina, Chile, Saudi Arabia, UAE, South Africa, Turkey, Israel

  • Structural expansion of gaming sector and demand for high-refresh displays is the driving factor this market.

The 4K2K TV market vendors should focus on grabbing business opportunities from the Display size segment as it accounted for the largest market share in the base year.
RIA - Research AI Assistant
Ask RIA