3D Scanner Market Analysis, Size, and Forecast 2025-2029: North America (US and Canada), Europe (France, Germany, Italy, and UK), APAC (China, India, Japan, and South Korea), and Rest of World (ROW)

3D Scanner Market Analysis, Size, and Forecast 2025-2029:
North America (US and Canada), Europe (France, Germany, Italy, and UK), APAC (China, India, Japan, and South Korea), and Rest of World (ROW)

Published: Jul 2025 223 Pages SKU: IRTNTR43838

Market Overview at a Glance

$5.65 B
Market Opportunity
12.6%
CAGR
10.8
YoY growth 2024-2025(%)

3D Scanner Market Size 2025-2029

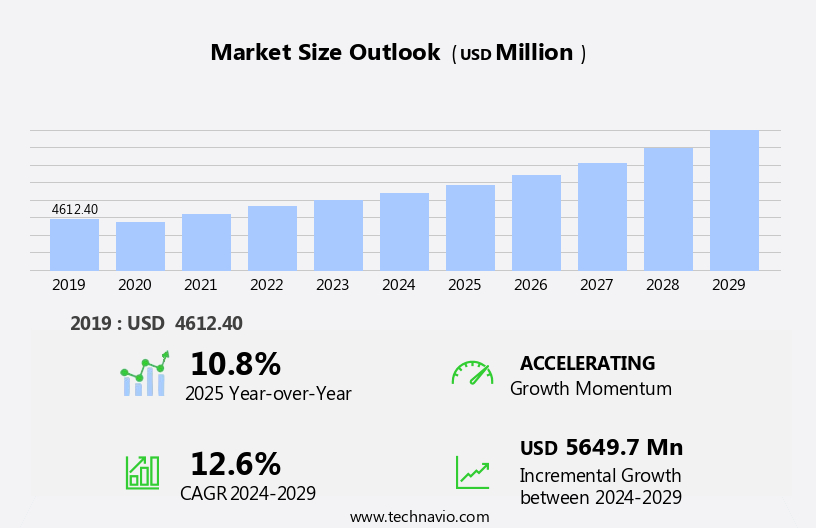
The 3D scanner market size is forecast to increase by USD 5.65 billion at a CAGR of 12.6% between 2024 and 2029.

  • The market is experiencing significant growth, driven primarily by the increasing adoption of portable handheld scanners. These devices offer enhanced flexibility and convenience, making them increasingly popular across various industries, including manufacturing, construction, and healthcare. However, the high cost of 3D scanners remains a notable challenge, limiting their widespread adoption.
  • Navigating the high cost barrier will be crucial for market success, as the integration of AI technology presents a significant opportunity to streamline processes and improve efficiency. Despite this obstacle, the integration of artificial intelligence (AI) technology into handheld 3D scanners is expected to drive innovation and potentially reduce costs. Companies seeking to capitalize on this market's potential should focus on developing affordable, AI-enabled handheld 3D scanners to cater to the evolving demands of businesses.

What will be the Size of the 3D Scanner Market during the forecast period?

3D Scanner Market Size

 Explore in-depth regional segment analysis with market size data - historical 2019-2023 and forecasts 2025-2029 - in the full report.  
Request Free Sample

The market is witnessing significant advancements in various areas, including pose estimation, system integration, and model simplification. Pose estimation enables accurate tracking of objects in real-time, enhancing the functionality of 3D scanning systems. System integration is crucial for seamless data flow between hardware and software components, ensuring efficient 3D animation pipelines and virtual reality applications. Model simplification techniques improve 3D model fidelity by reducing the complexity of scanned data, making it easier to process and manipulate. Hardware troubleshooting and calibration procedures are essential for maintaining the performance of 3D scanning systems, particularly when using depth sensor technology and dealing with scanning speed limits.

Computer vision, machine learning, and pattern recognition algorithms play a vital role in enhancing the accuracy assessment of 3D scanning data. Image segmentation and texture synthesis are essential for creating high-quality 3D models, while feature extraction and object tracking enable advanced applications in augmented reality and spatial resolution. Data acquisition rate and data compression are critical factors in optimizing 3D scanning workflows, ensuring efficient data visualization and 3D scene reconstruction. Precision engineering applications require high spatial resolution and temporal resolution, making them a growing market segment for 3D scanning technology.

Software debugging and sensor alignment are ongoing challenges in the 3D scanning industry, requiring continuous innovation to overcome scanning accuracy issues and improve overall system performance. Overall, the market is evolving rapidly, driven by advancements in hardware, software, and applications. Additionally, the use of oral care and dental practice management software is streamlining operations and enhancing patient care.

How is this 3D Scanner Industry segmented?

The 3D scanner industry research report provides comprehensive data (region-wise segment analysis), with forecasts and estimates in "USD million" for the period 2025-2029, as well as historical data from 2019-2023 for the following segments.

  • Technology
    • Laser triangulation
    • Structured light
  • End-user
    • Industrial manufacturing
    • Healthcare
    • Architecture and engineering
    • Aerospace and defense
    • Others
  • Product Type
    • Short-range
    • Medium-range
    • Long-range
  • Geography
    • North America
      • US
      • Canada
    • Europe
      • France
      • Germany
      • Italy
      • UK
    • APAC
      • China
      • India
      • Japan
      • South Korea
    • Rest of World (ROW)

By Technology Insights

The Laser triangulation segment is estimated to witness significant growth during the forecast period. The 3D scanning market is experiencing significant growth, driven by the increasing adoption of advanced technologies such as laser triangulation, non-contact measurement, and real-time 3D scanning. These technologies offer numerous benefits, including high-resolution imaging, geometric accuracy, and surface texture mapping. Motion compensation and registration algorithms enable seamless scanning of complex objects, while multi-sensor fusion and point cloud processing enhance data quality. Laser triangulation technology, in particular, is gaining popularity due to its high-accuracy measurements and wide application in industries such as industrial metrology, reverse engineering, and virtual prototyping.

The market is also witnessing the development of software development kits (SDKs) and mesh generation algorithms for easy integration with various applications. The 3D scanning market is witnessing a rise in demand due to its numerous applications in various industries and the continuous advancements in technology. The integration of advanced features like motion compensation, depth map generation, and real-time 3D scanning is expected to further propel the market's growth. From dental implants and orthotic solutions to full body scanning for medical diagnosis, 3D scanning offers numerous benefits in the healthcare industry.

3D Scanner Market Size

 Download Free Sample Report

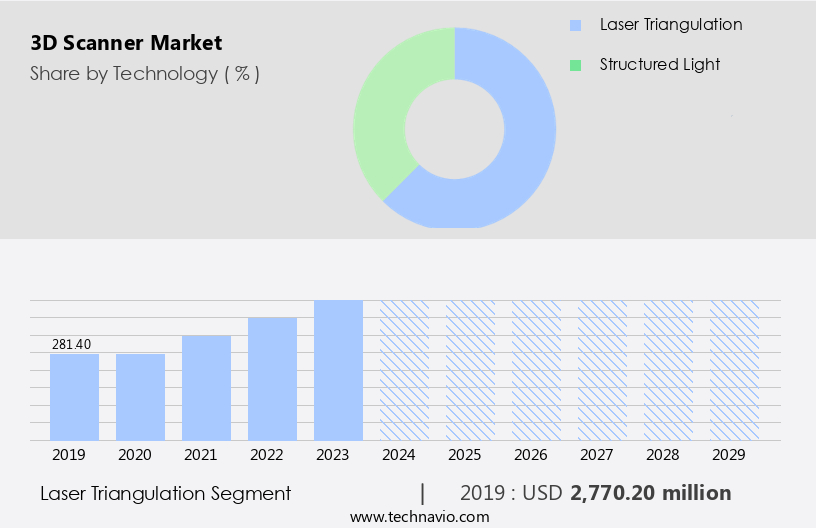
The Laser triangulation segment was valued at USD 2.77 billion in 2019 and showed a gradual increase during the forecast period.

The automotive and aerospace industries are major contributors to the market's growth due to their reliance on precise measurements for product development and maintenance. Furthermore, 3D scanning technology is being integrated with various software solutions such as CAD software, photogrammetry techniques, and 3D image rendering for digital asset creation and virtual prototyping. Time-of-flight 3D scanning and structured light scanning are other emerging technologies that offer advantages like long-range scanning and high-speed data acquisition.

Additionally, color data acquisition and noise reduction filters improve the overall quality of the scanned data. Moreover, the 3D scanning market is witnessing the integration of advanced technologies like optical coherence tomography, which offers high-resolution, non-contact measurements, and 3D model accuracy. This integration offers numerous benefits, including enhanced data security, improved accessibility, and increased efficiency.

Regional Analysis

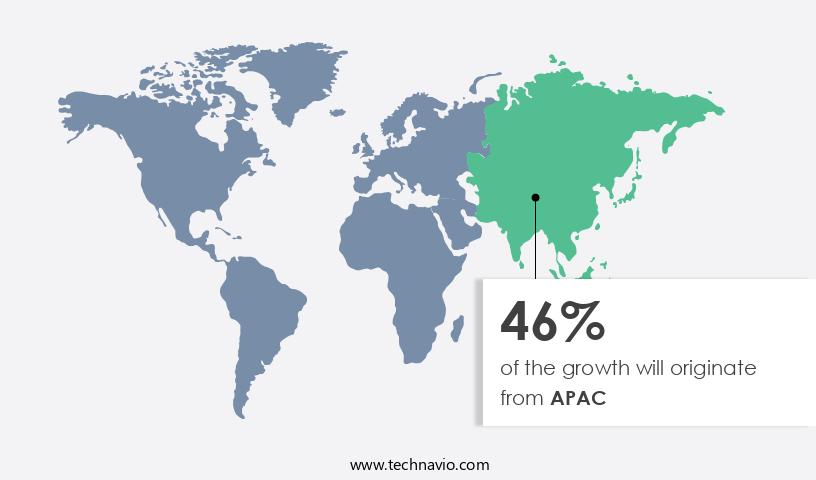
APAC is estimated to contribute 46% to the growth of the global market during the forecast period. Technavio's analysts have elaborately explained the regional trends and drivers that shape the market during the forecast period.

3D Scanner Market Share by Geography

View Free PDF Sample

The market in North America is experiencing significant growth, particularly in the aerospace and defense, and healthcare industries. Advanced 3D technologies, such as laser triangulation and structured light, are driving the deployment of 3D scanners in these sectors. The aerospace industry, with its strong presence in the US, is highly competitive and continually incorporates new technologies to gain an edge. In the healthcare industry, 3D scanning is revolutionizing medical procedures and diagnostics, leading to increased demand for high-resolution, non-contact measurement solutions. 3D scanning technology enables depth map generation, real-time 3D rendering, and data post-processing for various applications. Cloud-based document management systems are gaining popularity due to their flexibility, affordability, and accessibility.

Motion compensation and multi-sensor fusion ensure accurate and consistent scanning results. Point cloud processing and mesh generation algorithms facilitate the creation of digital assets for 3D printing workflows and virtual prototyping. Object recognition and texture analysis enhance the functionality of 3D scanners, while color data acquisition and noise reduction filters improve image quality. Industrial metrology applications require high geometric accuracy, which is achieved through advanced registration algorithms and calibration techniques. Optical coherence tomography and photogrammetry techniques are also gaining popularity for their unique capabilities in various industries. The integration of 3D scanning technology with CAD software and real-time 3D image rendering further expands its applications.

Reverse engineering and surface texture mapping are essential in various industries, including automotive and manufacturing, where high-precision measurements are crucial. Overall, the evolving the market is transforming industries by providing accurate, non-contact measurement solutions for various applications. In healthcare, these scanners are used for clinical applications like dental and thoracic chest scanning, as well as for simulating body measurements for prosthetics, orthotics, and body implants.

Market Dynamics

Our researchers analyzed the data with 2024 as the base year, along with the key drivers, trends, and challenges. A holistic analysis of drivers will help companies refine their marketing strategies to gain a competitive advantage.

What are the 3D Scanner market drivers leading to the rise in the adoption of Industry?

  • The significant rise in the adoption of portable handheld scanners serves as the primary catalyst for market growth. The market is witnessing substantial expansion due to the rising utilization of portable handheld scanners across numerous industries. These devices offer significant advantages, including non-contact measurement, geometric accuracy, and object recognition, making them increasingly popular. The adoption of portable scanners is driven by their flexibility and mobility, enabling users to capture 3D data in various settings, even in hard-to-reach areas. Industries such as manufacturing and healthcare are leveraging handheld scanners for precise measurements and quality control, as well as for streamlining processes and reducing costs.
  • Time-of-flight 3D scanning technology and software SDKs are further fueling the market growth by enabling seamless integration with 3D printing workflows. Overall, the market is poised for continued growth, driven by technological advancements and the increasing demand for precise, efficient, and flexible measurement solutions. Technological advancements have led to improvements in 3D scanner resolution, registration algorithms, and multi-sensor fusion, enhancing the overall performance and ease of use. These advancements have made 3D scanning more accessible and cost-effective, expanding its application base.

What are the 3D Scanner market trends shaping the Industry?

  • The use of AI-based handheld 3D scanners is gaining significant traction in the market. This advanced technology allows for precise and efficient 3D scanning, making it a must-have tool for professionals in various industries. The integration of artificial intelligence (AI) in 3D scanning technology is revolutionizing the industry, streamlining the process of creating 3D images and digital assets. AI enables the scanner to process large volumes of data on a single device, reducing user workload and enhancing efficiency. Furthermore, the integration of AI with CAD software allows for seamless digital asset creation and virtual prototyping.
  • Artec Europe Sarl's Artec Leo, a portable 3D scanner, showcases this innovation with its AI-based feature in Artec Studio 11 software, enabling fast data capture at up to 80 frames per second (FPS). This technology is transforming various industries, from manufacturing to healthcare, by facilitating rapid and accurate 3D image rendering and digital asset creation. With AI, 3D scanners can generate full-color 3D models using advanced techniques such as optical coherence tomography, photogrammetry, and color data acquisition. These models offer high 3D model accuracy and come with noise reduction filters for improved image quality.

How does 3D Scanner market face challenges during its growth?

  • The high cost of 3D scanners poses a significant challenge to the growth of the industry, as this advanced technology remains a financial barrier for many businesses and organizations seeking to adopt it. 3D scanners are essential tools for measurement and metrology, quality inspection, and reverse engineering, with pricing influenced by factors such as accuracy, resolution, speed, size, scanning environment, and integrated solutions. The end-user's application requirements determine the price range.
  • Incorporating 3D scanners into production processes, as in the automotive or aerospace industries, necessitates high robustness, ensuring consistent results and minimal errors. Calibration and texture analysis are additional features that enhance scanner performance, further contributing to the cost. Accuracy is the most significant factor, with high-priced scanners offering superior precision through advanced technologies like high-resolution imaging, structured light scanning, and mesh generation algorithms.

Exclusive Customer Landscape

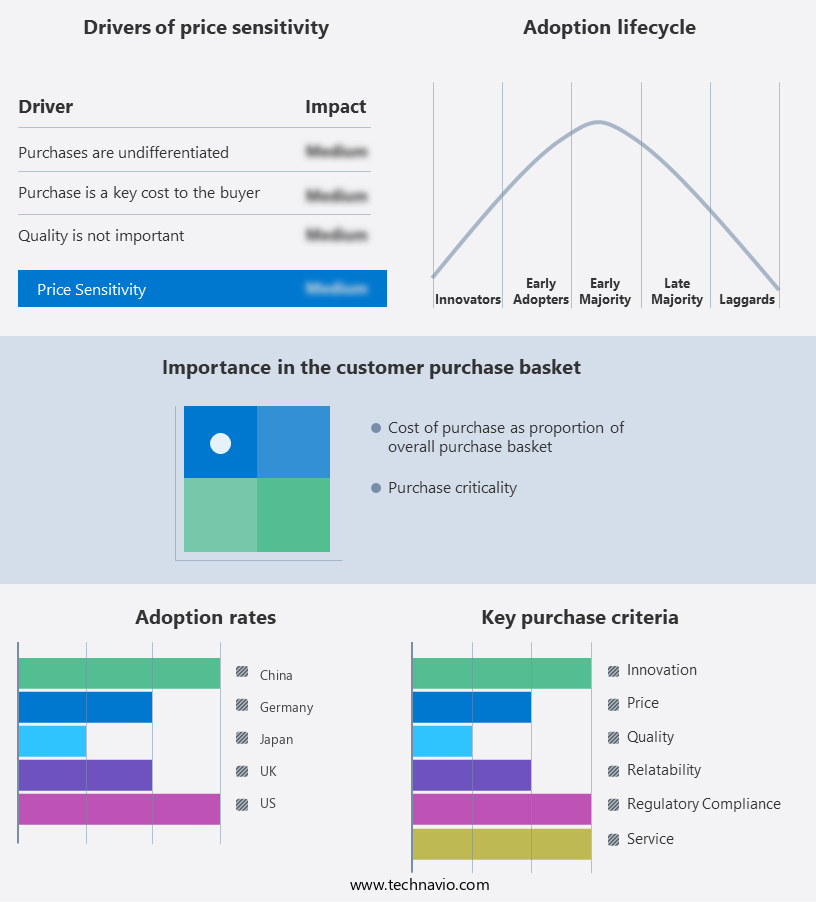
The 3D scanner market forecasting report includes the adoption lifecycle of the market, covering from the innovator's stage to the laggard's stage. It focuses on adoption rates in different regions based on penetration. Furthermore, the 3D scanner market report also includes key purchase criteria and drivers of price sensitivity to help companies evaluate and develop their market growth analysis strategies.

3D Scanner Market Share by Geography

 Customer Landscape

Key Companies & Market Insights

Companies are implementing various strategies, such as strategic alliances, 3D scanner market forecast, partnerships, mergers and acquisitions, geographical expansion, and product/service launches, to enhance their presence in the industry.

3D Systems Corp. - The company specializes in 3D scanning technology, catering to various industries such as jewelry, motorsports, semiconductors, medical devices, and bio printing.

The industry research and growth report includes detailed analyses of the competitive landscape of the market and information about key companies, including:

  • 3D Systems Corp.
  • AMETEK Inc.
  • Artec Europe Sarl
  • Atlas Copco AB
  • Capture 3D Inc.
  • Carl Zeiss AG
  • FARO Technologies Inc.
  • Fuel3D Technologies Ltd.
  • Hexagon AB
  • Kreon Technologies
  • Metrologic Group SAS
  • NextEngine Inc.
  • Nikon Corp.
  • Quality Vision lnternational lnc
  • RIEGL Laser Measurement Systems GmbH
  • Shining 3D Tech Co. Ltd.
  • SMARTTECH 3D
  • TOPCON Corp.
  • Trimble Inc.
  • Zoller and Frohlich GmbH

Qualitative and quantitative analysis of companies has been conducted to help clients understand the wider business environment as well as the strengths and weaknesses of key industry players. Data is qualitatively analyzed to categorize companies as pure play, category-focused, industry-focused, and diversified; it is quantitatively analyzed to categorize companies as dominant, leading, strong, tentative, and weak.

Recent Development and News in 3D Scanner Market

  • In January 2024, Stratasys Ltd., a leading 3D printing and scanning solutions provider, announced the launch of its new handheld 3D scanner, the J735, designed for industrial metrology applications (Stratasys Press Release, 2024). This new product expansion aimed to cater to the growing demand for portable and high-precision 3D scanning solutions.
  • In March 2024, HP Inc. and Microsoft Corporation announced a strategic partnership to integrate Microsoft's Azure AI and IoT services with HP's 3D scanning and printing solutions. This collaboration aimed to enhance the capabilities of HP's 3D scanning offerings and enable more advanced data processing and analysis (HP Press Release, 2024).
  • In May 2024, 3D Systems, a leading 3D printing and scanning company, completed the acquisition of DP Technology, a provider of industrial-grade 3D scanning and inspection systems. This acquisition strengthened 3D Systems' position in the industrial metrology market and expanded its product portfolio (3D Systems Press Release, 2024).
  • In January 2025, the European Union Agency for Cybersecurity granted a European Certification for the 3D scanning solution, Geomagic Design X, from 3D Systems. This certification confirmed the software's compliance with the EU's cybersecurity requirements, making it suitable for use in regulated industries (3D Systems Press Release, 2025).

Research Analyst Overview

The market continues to evolve, driven by advancements in technology and expanding applications across various sectors. Entities involved in this dynamic industry are constantly pushing the boundaries of 3D image rendering, digital asset creation, and optical coherence tomography. Real-time 3D scanning and data post-processing are increasingly important, with hardware specifications, such as motion compensation and scanning range limits, continually improving to meet evolving market demands. Optical coherence tomography and virtual prototyping are gaining traction, as 3D model accuracy and color data acquisition become more crucial. Noise reduction filters and CAD software integration are essential components, ensuring seamless workflows and high-quality outputs.

Photogrammetry techniques, reverse engineering, and high-resolution imaging are also integral parts of the 3D scanning landscape. Industrial metrology, time-of-flight 3D, and object recognition are key applications, with ongoing advancements in point cloud processing, surface texture mapping, and 3D printer workflows. The integration of software SDKs and mesh generation algorithms, along with 3D scanner calibration and texture analysis, further enhance the capabilities of these systems. Continuous innovation and the fusion of multiple sensors are shaping the future of the market. The ongoing evolution of registration algorithms, laser triangulation, and geometric accuracy, among other technologies, are ensuring that 3D scanning remains a vital tool for industries seeking to optimize their processes and create more accurate, efficient, and innovative solutions.

Dive into Technavio's robust research methodology, blending expert interviews, extensive data synthesis, and validated models for unparalleled 3D Scanner Market insights. See full methodology.

Market Scope

Report Coverage

Details

Page number

223

Base year

2024

Historic period

2019-2023

Forecast period

2025-2029

Growth momentum & CAGR

Accelerate at a CAGR of 12.6%

Market growth 2025-2029

USD 5.65 billion

Market structure

Fragmented

YoY growth 2024-2025(%)

10.8

Key countries

US, China, Germany, UK, Canada, France, India, Japan, Italy, and South Korea

Competitive landscape

Leading Companies, Market Positioning of Companies, Competitive Strategies, and Industry Risks

Request Free Sample

What are the Key Data Covered in this 3D Scanner Market Research and Growth Report?

  • CAGR of the 3D Scanner industry during the forecast period
  • Detailed information on factors that will drive the growth and forecasting between 2025 and 2029
  • Precise estimation of the size of the market and its contribution of the industry in focus to the parent market
  • Accurate predictions about upcoming growth and trends and changes in consumer behaviour
  • Growth of the market across North America, APAC, Europe, South America, and Middle East and Africa
  • Thorough analysis of the market's competitive landscape and detailed information about companies
  • Comprehensive analysis of factors that will challenge the 3D scanner market growth of industry companies

We can help! Our analysts can customize this 3D scanner market research report to meet your requirements.

Get in touch

1 Executive Summary

  • 1.1 Market overview
    • Executive Summary - Chart on Market Overview
    • Executive Summary - Data Table on Market Overview
    • Executive Summary - Chart on Global Market Characteristics
    • Executive Summary - Chart on Market by Geography
    • Executive Summary - Chart on Market Segmentation by Technology
    • Executive Summary - Chart on Market Segmentation by End-user
    • Executive Summary - Chart on Market Segmentation by Product Type
    • Executive Summary - Chart on Incremental Growth
    • Executive Summary - Data Table on Incremental Growth
    • Executive Summary - Chart on Company Market Positioning

2 Technavio Analysis

  • 2.1 Analysis of price sensitivity, lifecycle, customer purchase basket, adoption rates, and purchase criteria
    • Analysis of price sensitivity, lifecycle, customer purchase basket, adoption rates, and purchase criteria
  • 2.2 Criticality of inputs and Factors of differentiation
    • Overview on criticality of inputs and factors of differentiation
  • 2.3 Factors of disruption
    • Overview on factors of disruption
  • 2.4 Impact of drivers and challenges
    • Impact of drivers and challenges in 2024 and 2029

3 Market Landscape

  • 3.1 Market ecosystem
    • Parent Market
    • Data Table on - Parent Market
  • 3.2 Market characteristics
    • Market characteristics analysis
  • 3.3 Value chain analysis
    • Value chain analysis

4 Market Sizing

  • 4.1 Market definition
    • Offerings of companies included in the market definition
  • 4.2 Market segment analysis
    • Market segments
  • 4.3 Market size 2024
    • 4.4 Market outlook: Forecast for 2024-2029
      • Chart on Global - Market size and forecast 2024-2029 ($ million)
      • Data Table on Global - Market size and forecast 2024-2029 ($ million)
      • Chart on Global Market: Year-over-year growth 2024-2029 (%)
      • Data Table on Global Market: Year-over-year growth 2024-2029 (%)

    5 Historic Market Size

    • 5.1 Global 3D Scanner Market 2019 - 2023
      • Historic Market Size - Data Table on Global 3D Scanner Market 2019 - 2023 ($ million)
    • 5.2 Technology segment analysis 2019 - 2023
      • Historic Market Size - Technology Segment 2019 - 2023 ($ million)
    • 5.3 End-user segment analysis 2019 - 2023
      • Historic Market Size - End-user Segment 2019 - 2023 ($ million)
    • 5.4 Product Type segment analysis 2019 - 2023
      • Historic Market Size - Product Type Segment 2019 - 2023 ($ million)
    • 5.5 Geography segment analysis 2019 - 2023
      • Historic Market Size - Geography Segment 2019 - 2023 ($ million)
    • 5.6 Country segment analysis 2019 - 2023
      • Historic Market Size - Country Segment 2019 - 2023 ($ million)

    6 Qualitative Analysis

    • 6.1 The AI impact on Global 3D Scanner Market

      7 Five Forces Analysis

      • 7.1 Five forces summary
        • Five forces analysis - Comparison between 2024 and 2029
      • 7.2 Bargaining power of buyers
        • Bargaining power of buyers - Impact of key factors 2024 and 2029
      • 7.3 Bargaining power of suppliers
        • Bargaining power of suppliers - Impact of key factors in 2024 and 2029
      • 7.4 Threat of new entrants
        • Threat of new entrants - Impact of key factors in 2024 and 2029
      • 7.5 Threat of substitutes
        • Threat of substitutes - Impact of key factors in 2024 and 2029
      • 7.6 Threat of rivalry
        • Threat of rivalry - Impact of key factors in 2024 and 2029
      • 7.7 Market condition
        • Chart on Market condition - Five forces 2024 and 2029

      8 Market Segmentation by Technology

      • 8.1 Market segments
        • Chart on Technology - Market share 2024-2029 (%)
        • Data Table on Technology - Market share 2024-2029 (%)
      • 8.2 Comparison by Technology
        • Chart on Comparison by Technology
        • Data Table on Comparison by Technology
      • 8.3 Laser triangulation - Market size and forecast 2024-2029
        • Chart on Laser triangulation - Market size and forecast 2024-2029 ($ million)
        • Data Table on Laser triangulation - Market size and forecast 2024-2029 ($ million)
        • Chart on Laser triangulation - Year-over-year growth 2024-2029 (%)
        • Data Table on Laser triangulation - Year-over-year growth 2024-2029 (%)
      • 8.4 Structured light - Market size and forecast 2024-2029
        • Chart on Structured light - Market size and forecast 2024-2029 ($ million)
        • Data Table on Structured light - Market size and forecast 2024-2029 ($ million)
        • Chart on Structured light - Year-over-year growth 2024-2029 (%)
        • Data Table on Structured light - Year-over-year growth 2024-2029 (%)
      • 8.5 Market opportunity by Technology
        • Market opportunity by Technology ($ million)
        • Data Table on Market opportunity by Technology ($ million)

      9 Market Segmentation by End-user

      • 9.1 Market segments
        • Chart on End-user - Market share 2024-2029 (%)
        • Data Table on End-user - Market share 2024-2029 (%)
      • 9.2 Comparison by End-user
        • Chart on Comparison by End-user
        • Data Table on Comparison by End-user
      • 9.3 Industrial manufacturing - Market size and forecast 2024-2029
        • Chart on Industrial manufacturing - Market size and forecast 2024-2029 ($ million)
        • Data Table on Industrial manufacturing - Market size and forecast 2024-2029 ($ million)
        • Chart on Industrial manufacturing - Year-over-year growth 2024-2029 (%)
        • Data Table on Industrial manufacturing - Year-over-year growth 2024-2029 (%)
      • 9.4 Healthcare - Market size and forecast 2024-2029
        • Chart on Healthcare - Market size and forecast 2024-2029 ($ million)
        • Data Table on Healthcare - Market size and forecast 2024-2029 ($ million)
        • Chart on Healthcare - Year-over-year growth 2024-2029 (%)
        • Data Table on Healthcare - Year-over-year growth 2024-2029 (%)
      • 9.5 Architecture and engineering - Market size and forecast 2024-2029
        • Chart on Architecture and engineering - Market size and forecast 2024-2029 ($ million)
        • Data Table on Architecture and engineering - Market size and forecast 2024-2029 ($ million)
        • Chart on Architecture and engineering - Year-over-year growth 2024-2029 (%)
        • Data Table on Architecture and engineering - Year-over-year growth 2024-2029 (%)
      • 9.6 Aerospace and defense - Market size and forecast 2024-2029
        • Chart on Aerospace and defense - Market size and forecast 2024-2029 ($ million)
        • Data Table on Aerospace and defense - Market size and forecast 2024-2029 ($ million)
        • Chart on Aerospace and defense - Year-over-year growth 2024-2029 (%)
        • Data Table on Aerospace and defense - Year-over-year growth 2024-2029 (%)
      • 9.7 Others - Market size and forecast 2024-2029
        • Chart on Others - Market size and forecast 2024-2029 ($ million)
        • Data Table on Others - Market size and forecast 2024-2029 ($ million)
        • Chart on Others - Year-over-year growth 2024-2029 (%)
        • Data Table on Others - Year-over-year growth 2024-2029 (%)
      • 9.8 Market opportunity by End-user
        • Market opportunity by End-user ($ million)
        • Data Table on Market opportunity by End-user ($ million)

      10 Market Segmentation by Product Type

      • 10.1 Market segments
        • Chart on Product Type - Market share 2024-2029 (%)
        • Data Table on Product Type - Market share 2024-2029 (%)
      • 10.2 Comparison by Product Type
        • Chart on Comparison by Product Type
        • Data Table on Comparison by Product Type
      • 10.3 Short-range - Market size and forecast 2024-2029
        • Chart on Short-range - Market size and forecast 2024-2029 ($ million)
        • Data Table on Short-range - Market size and forecast 2024-2029 ($ million)
        • Chart on Short-range - Year-over-year growth 2024-2029 (%)
        • Data Table on Short-range - Year-over-year growth 2024-2029 (%)
      • 10.4 Medium-range - Market size and forecast 2024-2029
        • Chart on Medium-range - Market size and forecast 2024-2029 ($ million)
        • Data Table on Medium-range - Market size and forecast 2024-2029 ($ million)
        • Chart on Medium-range - Year-over-year growth 2024-2029 (%)
        • Data Table on Medium-range - Year-over-year growth 2024-2029 (%)
      • 10.5 Long-range - Market size and forecast 2024-2029
        • Chart on Long-range - Market size and forecast 2024-2029 ($ million)
        • Data Table on Long-range - Market size and forecast 2024-2029 ($ million)
        • Chart on Long-range - Year-over-year growth 2024-2029 (%)
        • Data Table on Long-range - Year-over-year growth 2024-2029 (%)
      • 10.6 Market opportunity by Product Type
        • Market opportunity by Product Type ($ million)
        • Data Table on Market opportunity by Product Type ($ million)

      11 Customer Landscape

      • 11.1 Customer landscape overview
        • Analysis of price sensitivity, lifecycle, customer purchase basket, adoption rates, and purchase criteria

      12 Geographic Landscape

      • 12.1 Geographic segmentation
        • Chart on Market share by geography 2024-2029 (%)
        • Data Table on Market share by geography 2024-2029 (%)
      • 12.2 Geographic comparison
        • Chart on Geographic comparison
        • Data Table on Geographic comparison
      • 12.3 North America - Market size and forecast 2024-2029
        • Chart on North America - Market size and forecast 2024-2029 ($ million)
        • Data Table on North America - Market size and forecast 2024-2029 ($ million)
        • Chart on North America - Year-over-year growth 2024-2029 (%)
        • Data Table on North America - Year-over-year growth 2024-2029 (%)
      • 12.4 APAC - Market size and forecast 2024-2029
        • Chart on APAC - Market size and forecast 2024-2029 ($ million)
        • Data Table on APAC - Market size and forecast 2024-2029 ($ million)
        • Chart on APAC - Year-over-year growth 2024-2029 (%)
        • Data Table on APAC - Year-over-year growth 2024-2029 (%)
      • 12.5 Europe - Market size and forecast 2024-2029
        • Chart on Europe - Market size and forecast 2024-2029 ($ million)
        • Data Table on Europe - Market size and forecast 2024-2029 ($ million)
        • Chart on Europe - Year-over-year growth 2024-2029 (%)
        • Data Table on Europe - Year-over-year growth 2024-2029 (%)
      • 12.6 South America - Market size and forecast 2024-2029
        • Chart on South America - Market size and forecast 2024-2029 ($ million)
        • Data Table on South America - Market size and forecast 2024-2029 ($ million)
        • Chart on South America - Year-over-year growth 2024-2029 (%)
        • Data Table on South America - Year-over-year growth 2024-2029 (%)
      • 12.7 Middle East and Africa - Market size and forecast 2024-2029
        • Chart on Middle East and Africa - Market size and forecast 2024-2029 ($ million)
        • Data Table on Middle East and Africa - Market size and forecast 2024-2029 ($ million)
        • Chart on Middle East and Africa - Year-over-year growth 2024-2029 (%)
        • Data Table on Middle East and Africa - Year-over-year growth 2024-2029 (%)
      • 12.8 US - Market size and forecast 2024-2029
        • Chart on US - Market size and forecast 2024-2029 ($ million)
        • Data Table on US - Market size and forecast 2024-2029 ($ million)
        • Chart on US - Year-over-year growth 2024-2029 (%)
        • Data Table on US - Year-over-year growth 2024-2029 (%)
      • 12.9 China - Market size and forecast 2024-2029
        • Chart on China - Market size and forecast 2024-2029 ($ million)
        • Data Table on China - Market size and forecast 2024-2029 ($ million)
        • Chart on China - Year-over-year growth 2024-2029 (%)
        • Data Table on China - Year-over-year growth 2024-2029 (%)
      • 12.10 India - Market size and forecast 2024-2029
        • Chart on India - Market size and forecast 2024-2029 ($ million)
        • Data Table on India - Market size and forecast 2024-2029 ($ million)
        • Chart on India - Year-over-year growth 2024-2029 (%)
        • Data Table on India - Year-over-year growth 2024-2029 (%)
      • 12.11 Germany - Market size and forecast 2024-2029
        • Chart on Germany - Market size and forecast 2024-2029 ($ million)
        • Data Table on Germany - Market size and forecast 2024-2029 ($ million)
        • Chart on Germany - Year-over-year growth 2024-2029 (%)
        • Data Table on Germany - Year-over-year growth 2024-2029 (%)
      • 12.12 Canada - Market size and forecast 2024-2029
        • Chart on Canada - Market size and forecast 2024-2029 ($ million)
        • Data Table on Canada - Market size and forecast 2024-2029 ($ million)
        • Chart on Canada - Year-over-year growth 2024-2029 (%)
        • Data Table on Canada - Year-over-year growth 2024-2029 (%)
      • 12.13 UK - Market size and forecast 2024-2029
        • Chart on UK - Market size and forecast 2024-2029 ($ million)
        • Data Table on UK - Market size and forecast 2024-2029 ($ million)
        • Chart on UK - Year-over-year growth 2024-2029 (%)
        • Data Table on UK - Year-over-year growth 2024-2029 (%)
      • 12.14 Japan - Market size and forecast 2024-2029
        • Chart on Japan - Market size and forecast 2024-2029 ($ million)
        • Data Table on Japan - Market size and forecast 2024-2029 ($ million)
        • Chart on Japan - Year-over-year growth 2024-2029 (%)
        • Data Table on Japan - Year-over-year growth 2024-2029 (%)
      • 12.15 France - Market size and forecast 2024-2029
        • Chart on France - Market size and forecast 2024-2029 ($ million)
        • Data Table on France - Market size and forecast 2024-2029 ($ million)
        • Chart on France - Year-over-year growth 2024-2029 (%)
        • Data Table on France - Year-over-year growth 2024-2029 (%)
      • 12.16 Italy - Market size and forecast 2024-2029
        • Chart on Italy - Market size and forecast 2024-2029 ($ million)
        • Data Table on Italy - Market size and forecast 2024-2029 ($ million)
        • Chart on Italy - Year-over-year growth 2024-2029 (%)
        • Data Table on Italy - Year-over-year growth 2024-2029 (%)
      • 12.17 South Korea - Market size and forecast 2024-2029
        • Chart on South Korea - Market size and forecast 2024-2029 ($ million)
        • Data Table on South Korea - Market size and forecast 2024-2029 ($ million)
        • Chart on South Korea - Year-over-year growth 2024-2029 (%)
        • Data Table on South Korea - Year-over-year growth 2024-2029 (%)
      • 12.18 Market opportunity by geography
        • Market opportunity by geography ($ million)
        • Data Tables on Market opportunity by geography ($ million)

      13 Drivers, Challenges, and Opportunity/Restraints

      • 13.1 Market drivers
        • 13.2 Market challenges
          • 13.3 Impact of drivers and challenges
            • Impact of drivers and challenges in 2024 and 2029
          • 13.4 Market opportunities/restraints

            14 Competitive Landscape

            • 14.1 Overview
              • 14.2 Competitive Landscape
                • Overview on criticality of inputs and factors of differentiation
              • 14.3 Landscape disruption
                • Overview on factors of disruption
              • 14.4 Industry risks
                • Impact of key risks on business

              15 Competitive Analysis

              • 15.1 Companies profiled
                • Companies covered
              • 15.2 Company ranking index
                • Company ranking index
              • 15.3 Market positioning of companies
                • Matrix on companies position and classification
              • 3D Systems Corp.
                • 3D Systems Corp. - Overview
                • 3D Systems Corp. - Business segments
                • 3D Systems Corp. - Key news
                • 3D Systems Corp. - Key offerings
                • 3D Systems Corp. - Segment focus
                • SWOT
              • 15.5 AMETEK Inc.
                • AMETEK Inc. - Overview
                • AMETEK Inc. - Business segments
                • AMETEK Inc. - Key news
                • AMETEK Inc. - Key offerings
                • AMETEK Inc. - Segment focus
                • SWOT
              • 15.6 Artec Europe Sarl
                • Artec Europe Sarl - Overview
                • Artec Europe Sarl - Product / Service
                • Artec Europe Sarl - Key offerings
                • SWOT
              • 15.7 Atlas Copco AB
                • Atlas Copco AB - Overview
                • Atlas Copco AB - Business segments
                • Atlas Copco AB - Key news
                • Atlas Copco AB - Key offerings
                • Atlas Copco AB - Segment focus
                • SWOT
              • 15.8 Capture 3D Inc.
                • Capture 3D Inc. - Overview
                • Capture 3D Inc. - Product / Service
                • Capture 3D Inc. - Key offerings
                • SWOT
              • 15.9 Carl Zeiss AG
                • Carl Zeiss AG - Overview
                • Carl Zeiss AG - Product / Service
                • Carl Zeiss AG - Key news
                • Carl Zeiss AG - Key offerings
                • SWOT
              • 15.10 FARO Technologies Inc.
                • FARO Technologies Inc. - Overview
                • FARO Technologies Inc. - Product / Service
                • FARO Technologies Inc. - Key offerings
                • SWOT
              • 15.11 Fuel3D Technologies Ltd.
                • Fuel3D Technologies Ltd. - Overview
                • Fuel3D Technologies Ltd. - Product / Service
                • Fuel3D Technologies Ltd. - Key offerings
                • SWOT
              • 15.12 Hexagon AB
                • Hexagon AB - Overview
                • Hexagon AB - Business segments
                • Hexagon AB - Key news
                • Hexagon AB - Key offerings
                • Hexagon AB - Segment focus
                • SWOT
              • 15.13 Kreon Technologies
                • Kreon Technologies - Overview
                • Kreon Technologies - Product / Service
                • Kreon Technologies - Key offerings
                • SWOT
              • 15.14 NextEngine Inc.
                • NextEngine Inc. - Overview
                • NextEngine Inc. - Product / Service
                • NextEngine Inc. - Key offerings
                • SWOT
              • 15.15 Nikon Corp.
                • Nikon Corp. - Overview
                • Nikon Corp. - Business segments
                • Nikon Corp. - Key offerings
                • Nikon Corp. - Segment focus
                • SWOT
              • 15.16 Quality Vision lnternational lnc
                • Quality Vision lnternational lnc - Overview
                • Quality Vision lnternational lnc - Product / Service
                • Quality Vision lnternational lnc - Key offerings
                • SWOT
              • 15.17 TOPCON Corp.
                • TOPCON Corp. - Overview
                • TOPCON Corp. - Business segments
                • TOPCON Corp. - Key offerings
                • TOPCON Corp. - Segment focus
                • SWOT
              • 15.18 Trimble Inc.
                • Trimble Inc. - Overview
                • Trimble Inc. - Business segments
                • Trimble Inc. - Key news
                • Trimble Inc. - Key offerings
                • Trimble Inc. - Segment focus
                • SWOT

              16 Appendix

              • 16.1 Scope of the report
                • 16.2 Inclusions and exclusions checklist
                  • Inclusions checklist
                  • Exclusions checklist
                • 16.3 Currency conversion rates for US$
                  • Currency conversion rates for US$
                • 16.4 Research methodology
                  • Research methodology
                • 16.5 Data procurement
                  • Information sources
                • 16.6 Data validation
                  • Data validation
                • 16.7 Validation techniques employed for market sizing
                  • Validation techniques employed for market sizing
                • 16.8 Data synthesis
                  • Data synthesis
                • 16.9 360 degree market analysis
                  • 360 degree market analysis
                • 16.10 List of abbreviations
                  • List of abbreviations

                Research Methodology

                Technavio presents a detailed picture of the market by way of study, synthesis, and summation of data from multiple sources. The analysts have presented the various facets of the market with a particular focus on identifying the key industry influencers. The data thus presented is comprehensive, reliable, and the result of extensive research, both primary and secondary.

                INFORMATION SOURCES

                Primary sources

                • Manufacturers and suppliers
                • Channel partners
                • Industry experts
                • Strategic decision makers

                Secondary sources

                • Industry journals and periodicals
                • Government data
                • Financial reports of key industry players
                • Historical data
                • Press releases

                DATA ANALYSIS

                Data Synthesis

                • Collation of data
                • Estimation of key figures
                • Analysis of derived insights

                Data Validation

                • Triangulation with data models
                • Reference against proprietary databases
                • Corroboration with industry experts

                REPORT WRITING

                Qualitative

                • Market drivers
                • Market challenges
                • Market trends
                • Five forces analysis

                Quantitative

                • Market size and forecast
                • Market segmentation
                • Geographical insights
                • Competitive landscape

                Interested in this report?

                Get your sample now to see our research methodology and insights!

                Download Now

                Frequently Asked Questions

                3D Scanner market growth will increase by $ 5649.7 mn during 2025-2029.

                The 3D Scanner market is expected to grow at a CAGR of 12.6% during 2025-2029.

                3D Scanner market is segmented by Technology( Laser triangulation, Structured light) End-user( Industrial manufacturing, Healthcare, Architecture and engineering, Aerospace and defense, Others) Product Type( Short-range, Medium-range, Long-range, South America, MEA)

                3D Systems Corp., AMETEK Inc., Artec Europe Sarl, Atlas Copco AB, Capture 3D Inc., Carl Zeiss AG, FARO Technologies Inc., Fuel3D Technologies Ltd., Hexagon AB, Kreon Technologies, Metrologic Group SAS, NextEngine Inc., Nikon Corp., Quality Vision lnternational lnc, RIEGL Laser Measurement Systems GmbH, Shining 3D Tech Co. Ltd., SMARTTECH 3D, TOPCON Corp., Trimble Inc., Zoller and Frohlich GmbH are a few of the key vendors in the 3D Scanner market.

                APAC will register the highest growth rate of 46% among the other regions. Therefore, the 3D Scanner market in APAC is expected to garner significant business opportunities for the vendors during the forecast period.

                US, China, Germany, UK, Canada, France, India, Japan, Italy, South Korea

                • Increase in adoption of portable handheld scannersThe global 3D scanner market is experiencing significant growth is the driving factor this market.
                • driven by the increasing adoption of portable handheld scanners across various industries. These devices offer enhanced flexibility and mobility is the driving factor this market.
                • allowing users to efficiently capture 3D data in diverse environments is the driving factor this market.
                • including hard-to-reach areas. This portability eliminates the need for bulky and expensive stationary equipment is the driving factor this market.
                • making 3D scanning more accessible for a wider range of applications. Technological advancements have resulted in portable scanners boasting improved accuracy is the driving factor this market.
                • speed is the driving factor this market.
                • and ease of use is the driving factor this market.
                • further boosting their popularity. Industries like manufacturing and healthcare are increasingly relying on handheld scanners for precise measurements and quality control is the driving factor this market.
                • while also benefiting from their cost and time-saving capabilities. Furthermore is the driving factor this market.
                • the integration of features like artificial intelligence (AI) and cloud connectivity into these scanners is streamlining data analysis and enabling remote collaboration is the driving factor this market.
                • thus increasing their efficiency and appeal. The rise of Industry 4.0 and the growing demand for rapid prototyping and reverse engineering also contribute to the rising demand for portable handheld scanners is the driving factor this market.
                • as they provide efficient data collection methods crucial for these processes. Overall is the driving factor this market.
                • the versatility is the driving factor this market.
                • advanced features is the driving factor this market.
                • and increasing affordability of portable handheld scanners are making them indispensable tools for a variety of sectors is the driving factor this market.
                • thereby driving the expansion of the global 3D scanner market. is the driving factor this market.

                The 3D Scanner market vendors should focus on grabbing business opportunities from the Laser triangulation segment as it accounted for the largest market share in the base year.